> ## Documentation Index
> Fetch the complete documentation index at: https://docs.melonly.xyz/llms.txt
> Use this file to discover all available pages before exploring further.
# Analytics
> View detailed activity analytics for your ERLC server including player activity, map heatmaps, and performance insights.
***
## What are Analytics?
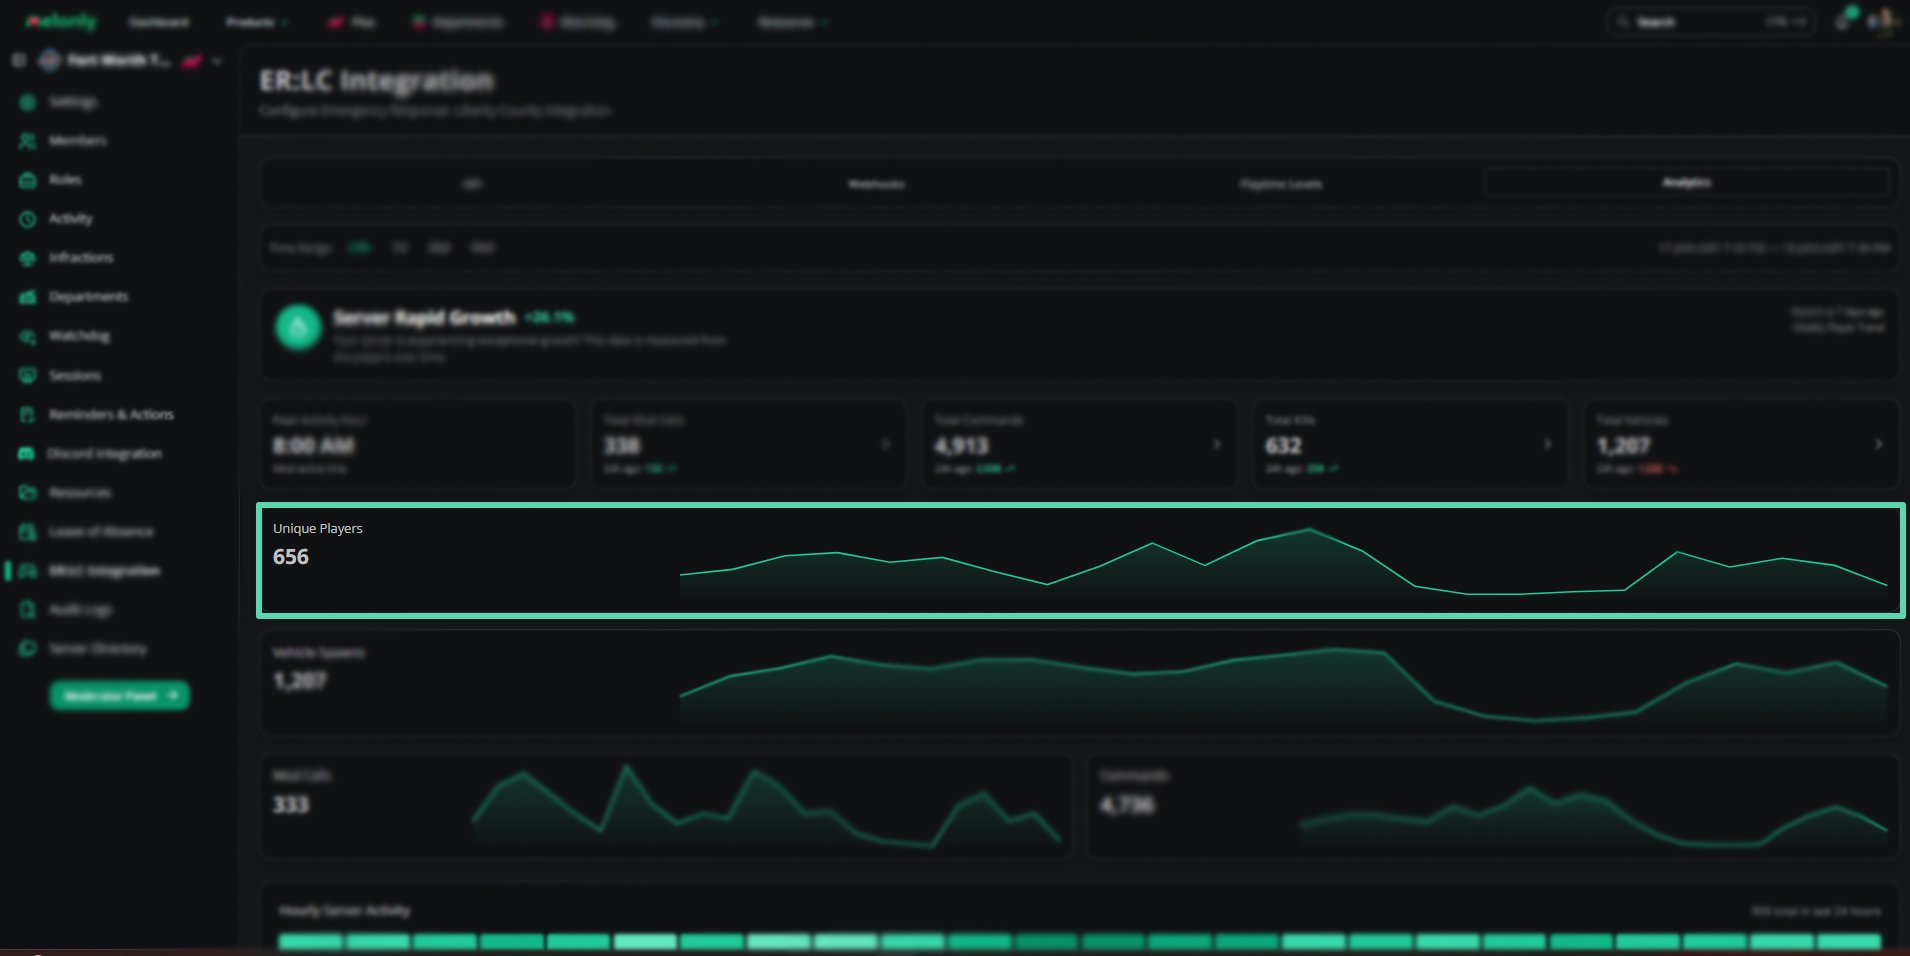
Analytics gives you a detailed overview of your ER:LC private server's activity over time. From player counts to mod calls, every key metric is tracked and displayed in an easy to read dashboard.
You can view data across four time ranges - 24 hours, 7 days, 30 days, and 90 days - so you can spot trends and understand how your server is performing over time.
Analytics also includes a map activity heatmap, hourly activity breakdowns, and a player leaderboard, giving server owners and staff a full picture of what is happening in their server.
***
## How Analytics Works
Melonly continuously collects data from your ER:LC private server through the integration and displays it in your dashboard. Metrics are updated in real time and stored so you can review trends.
Player-level data such as kills, playtime, commands used, and deaths are tracked individually, allowing you to compare player performance and identify your most active community members.
***
## Configuration Options
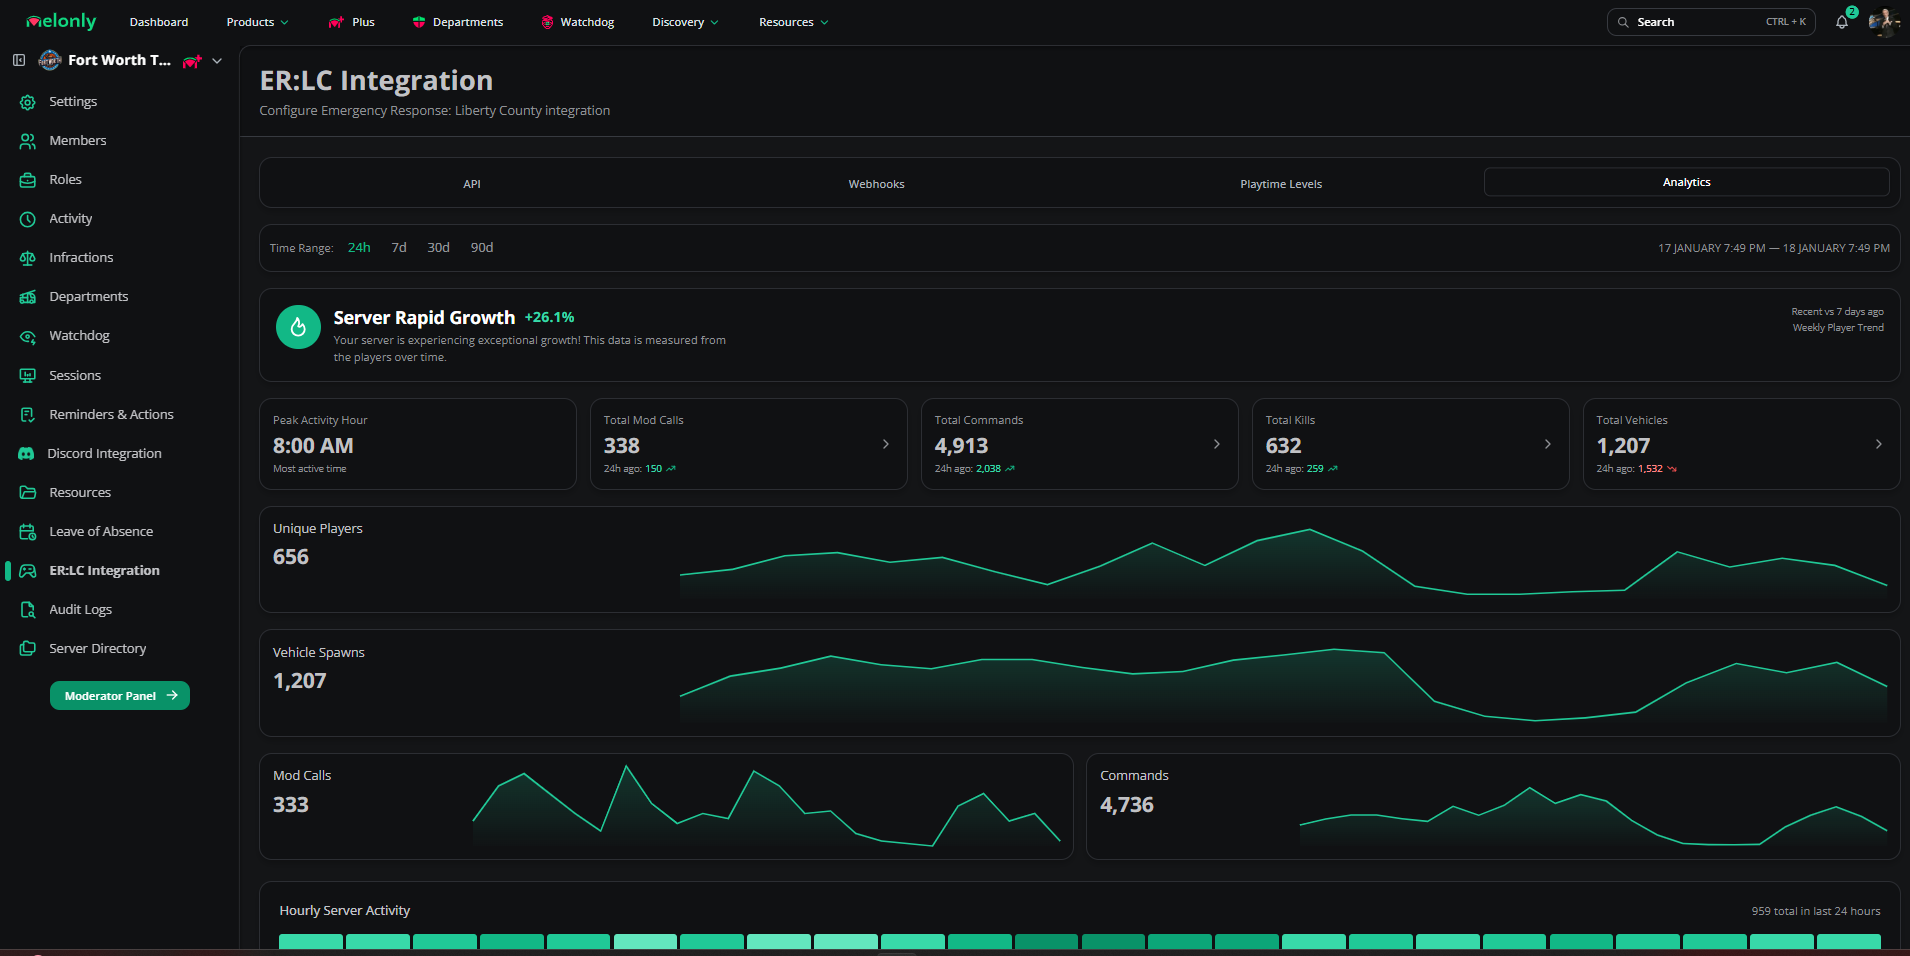
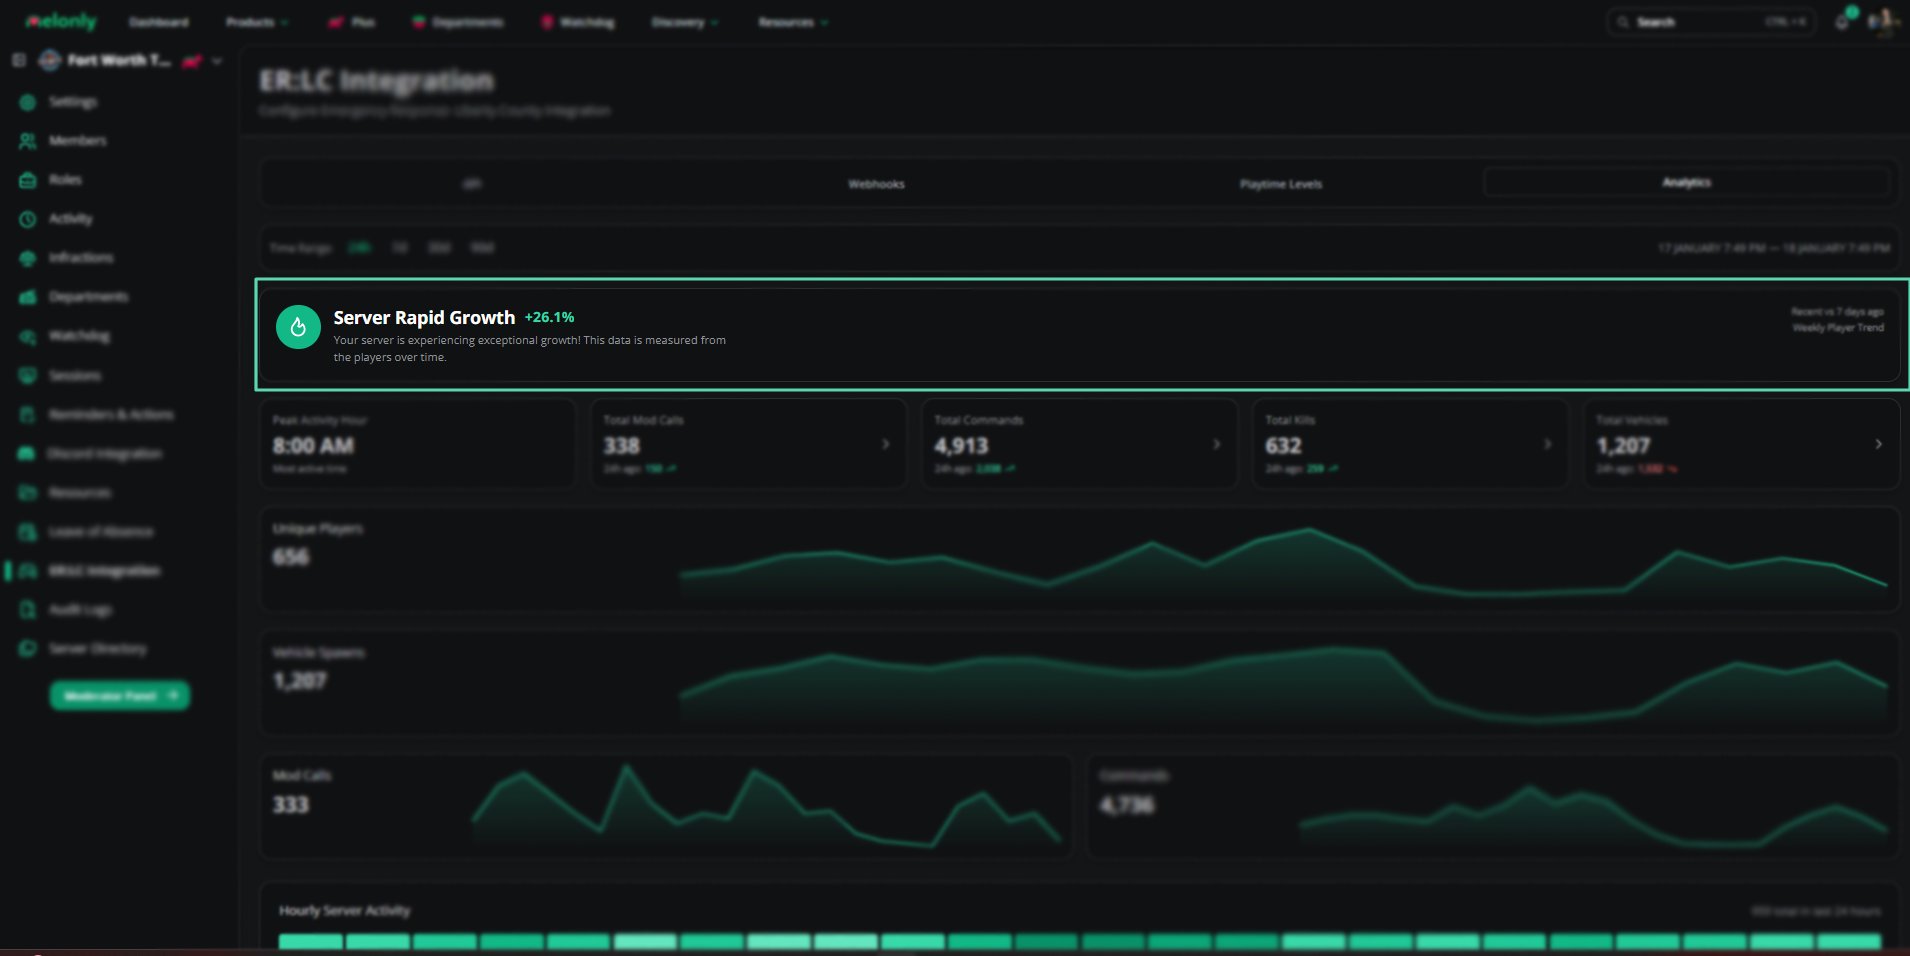 | Metric | Description |
| ------------------ | ------------------------------------------------------------------------------------- |
| Server Health | A weighted score comparing your server's current engagement to the previous 12 hours. |
| Time Range | Filter all analytics data by 24 hours, 7 days, 30 days, or 90 days. |
| Peak Activity Hour | The hour of the day with the most server activity. |
| Unique Players | The number of distinct players who joined the server in the selected period. |
| Metric | Description |
| ------------------ | ------------------------------------------------------------------------------------- |
| Server Health | A weighted score comparing your server's current engagement to the previous 12 hours. |
| Time Range | Filter all analytics data by 24 hours, 7 days, 30 days, or 90 days. |
| Peak Activity Hour | The hour of the day with the most server activity. |
| Unique Players | The number of distinct players who joined the server in the selected period. |
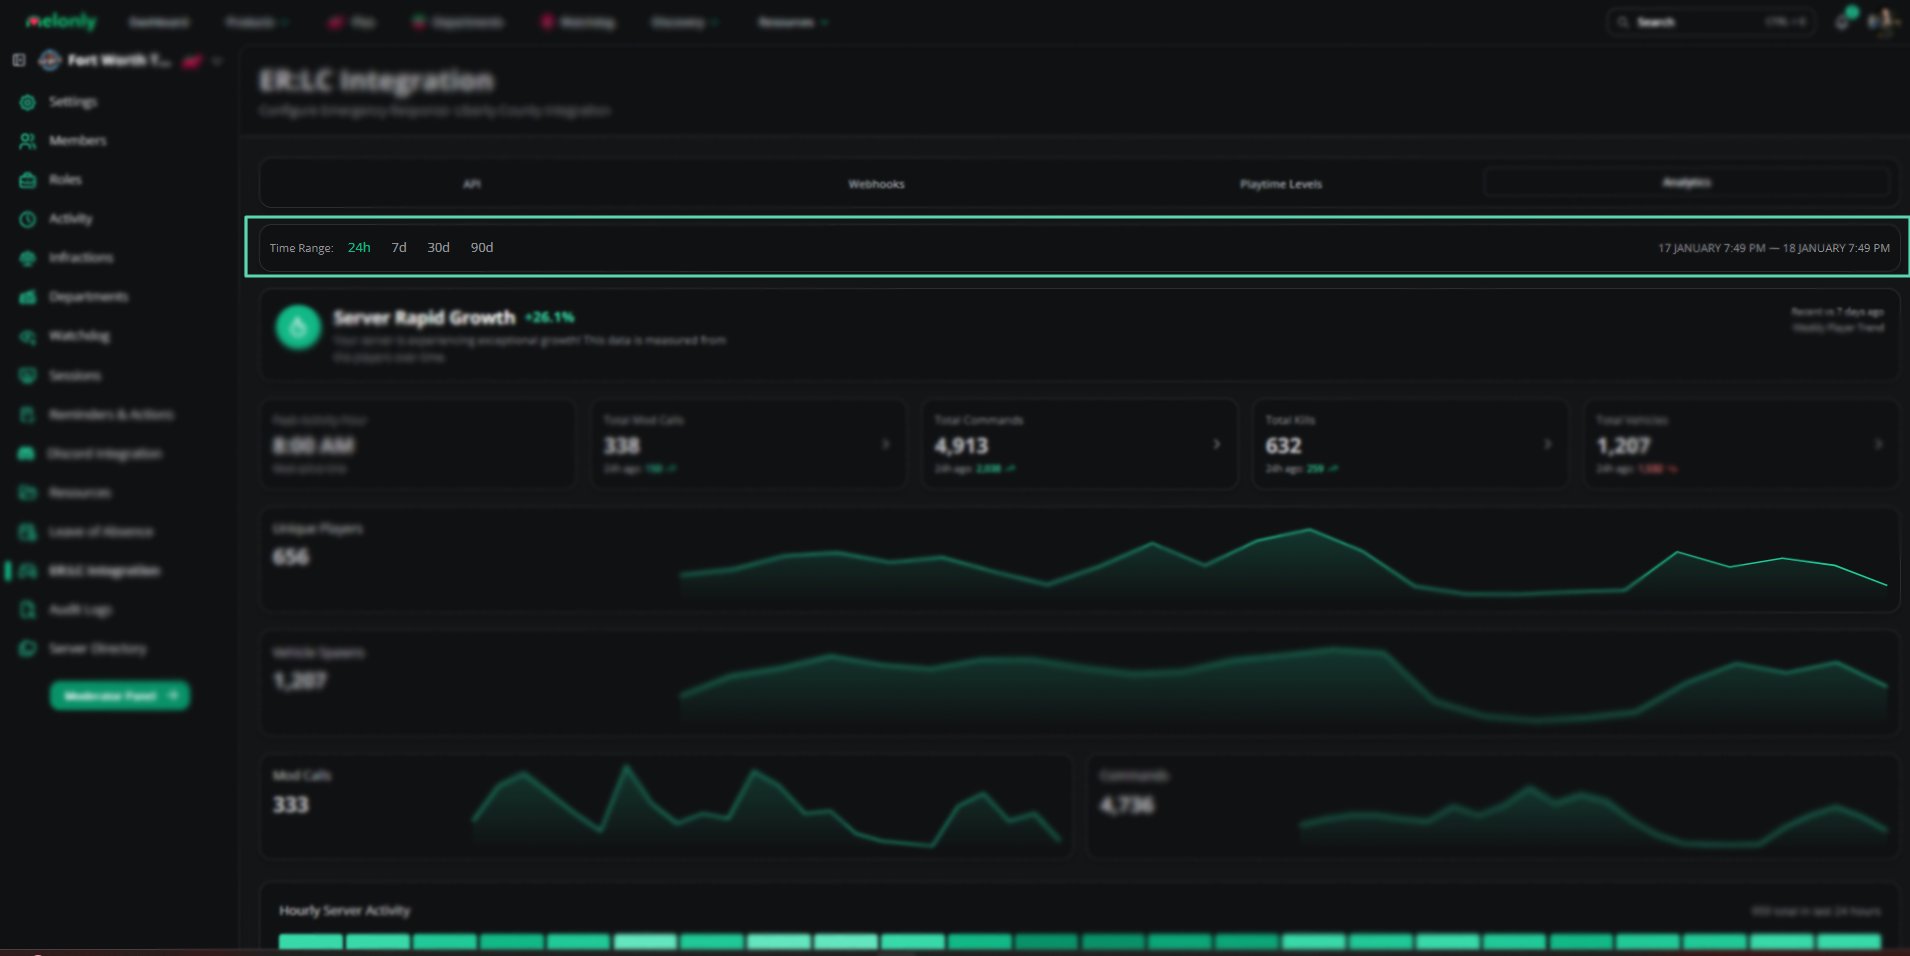 ***
### Activity Metrics
***
### Activity Metrics
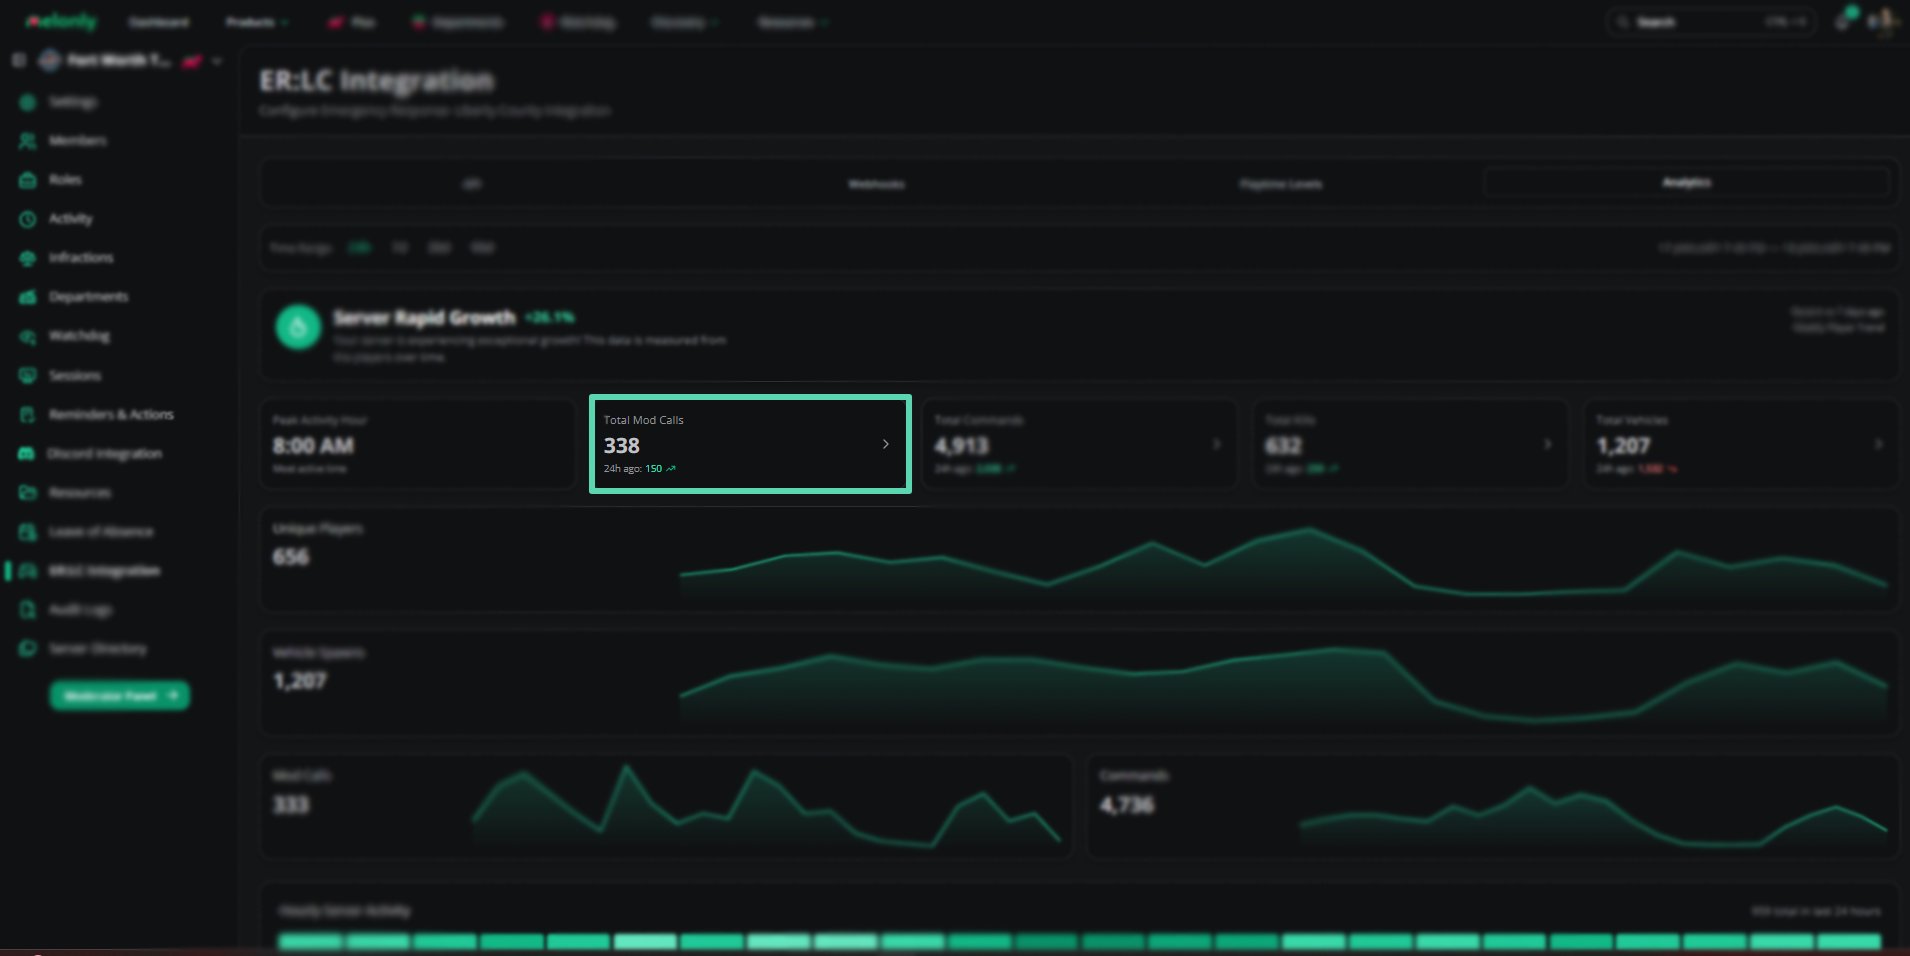
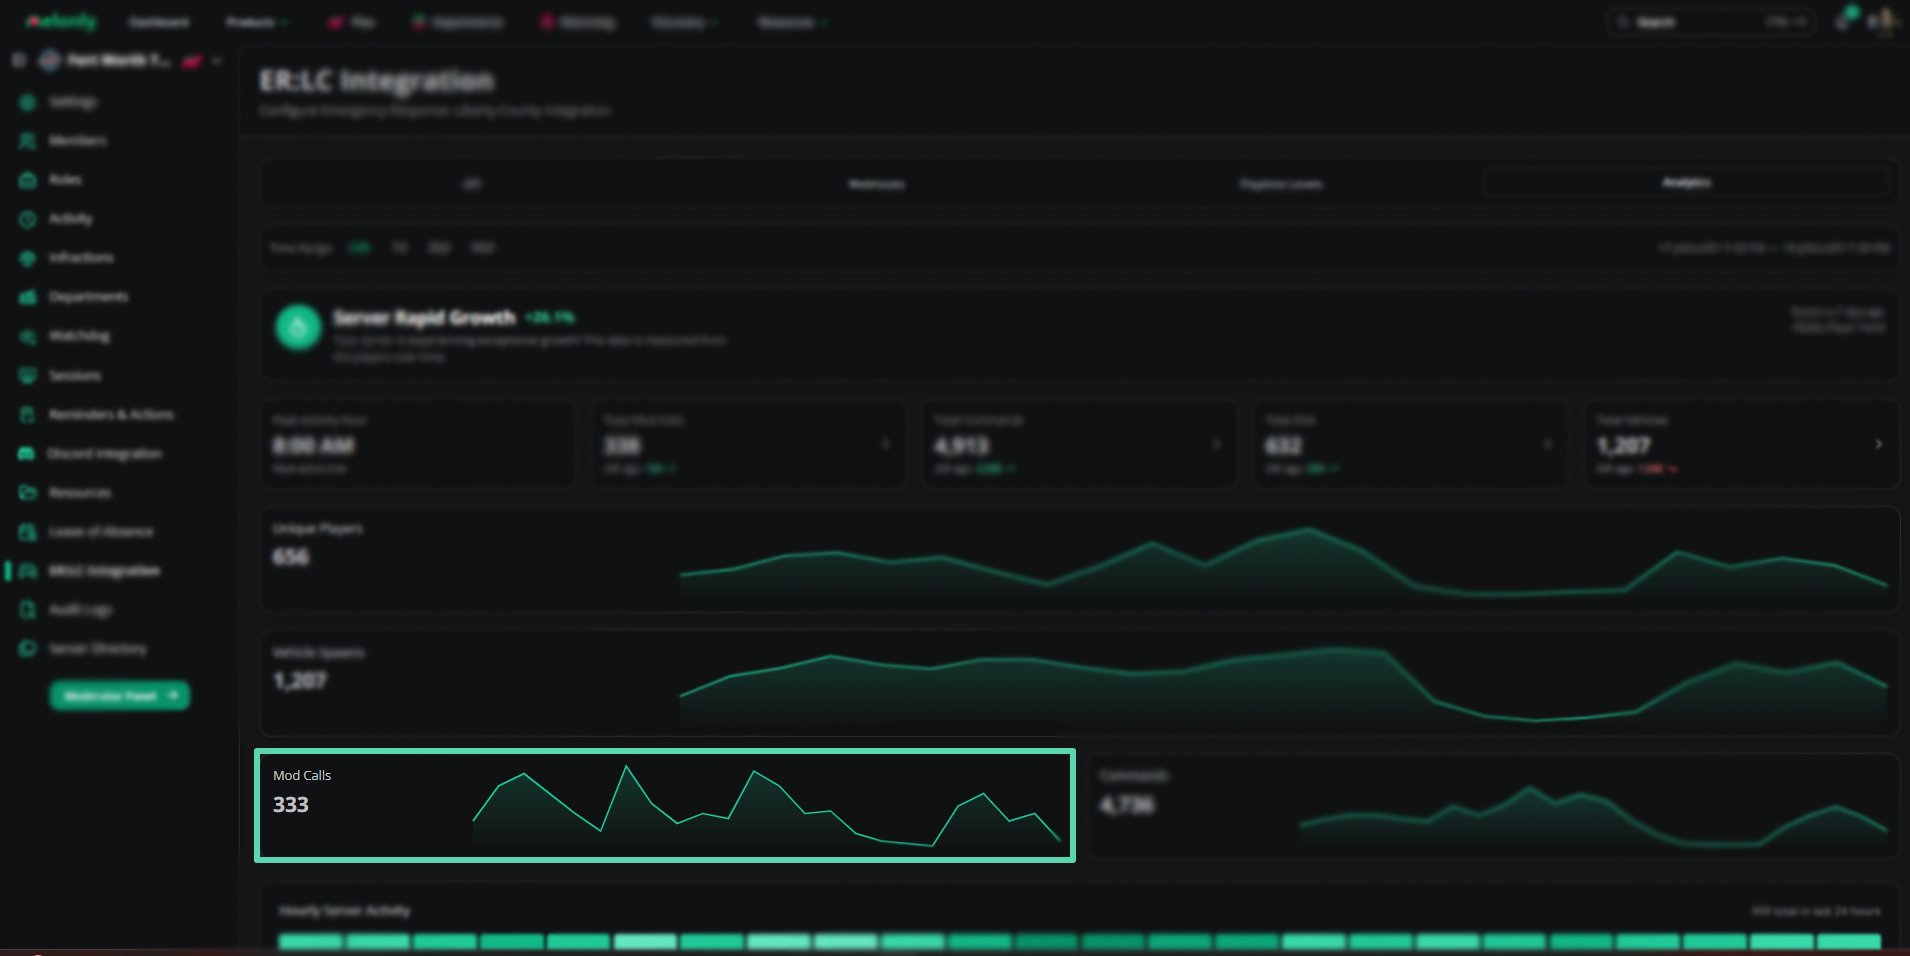
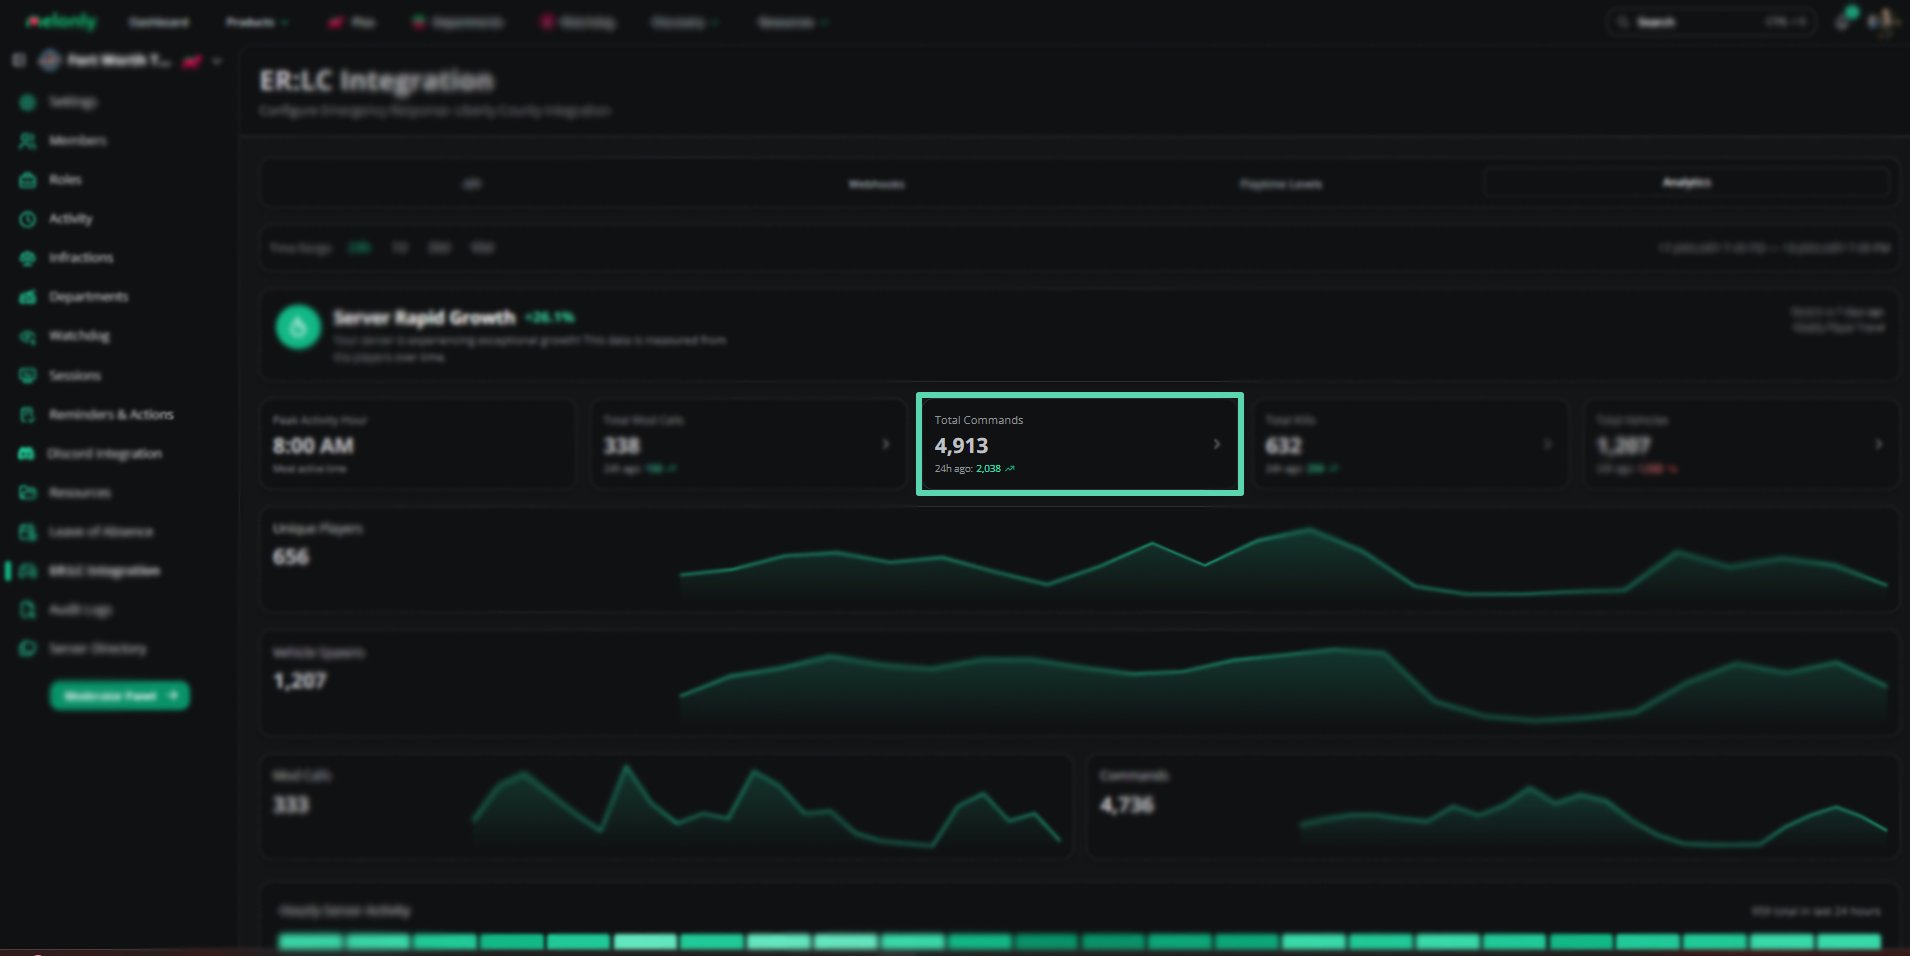
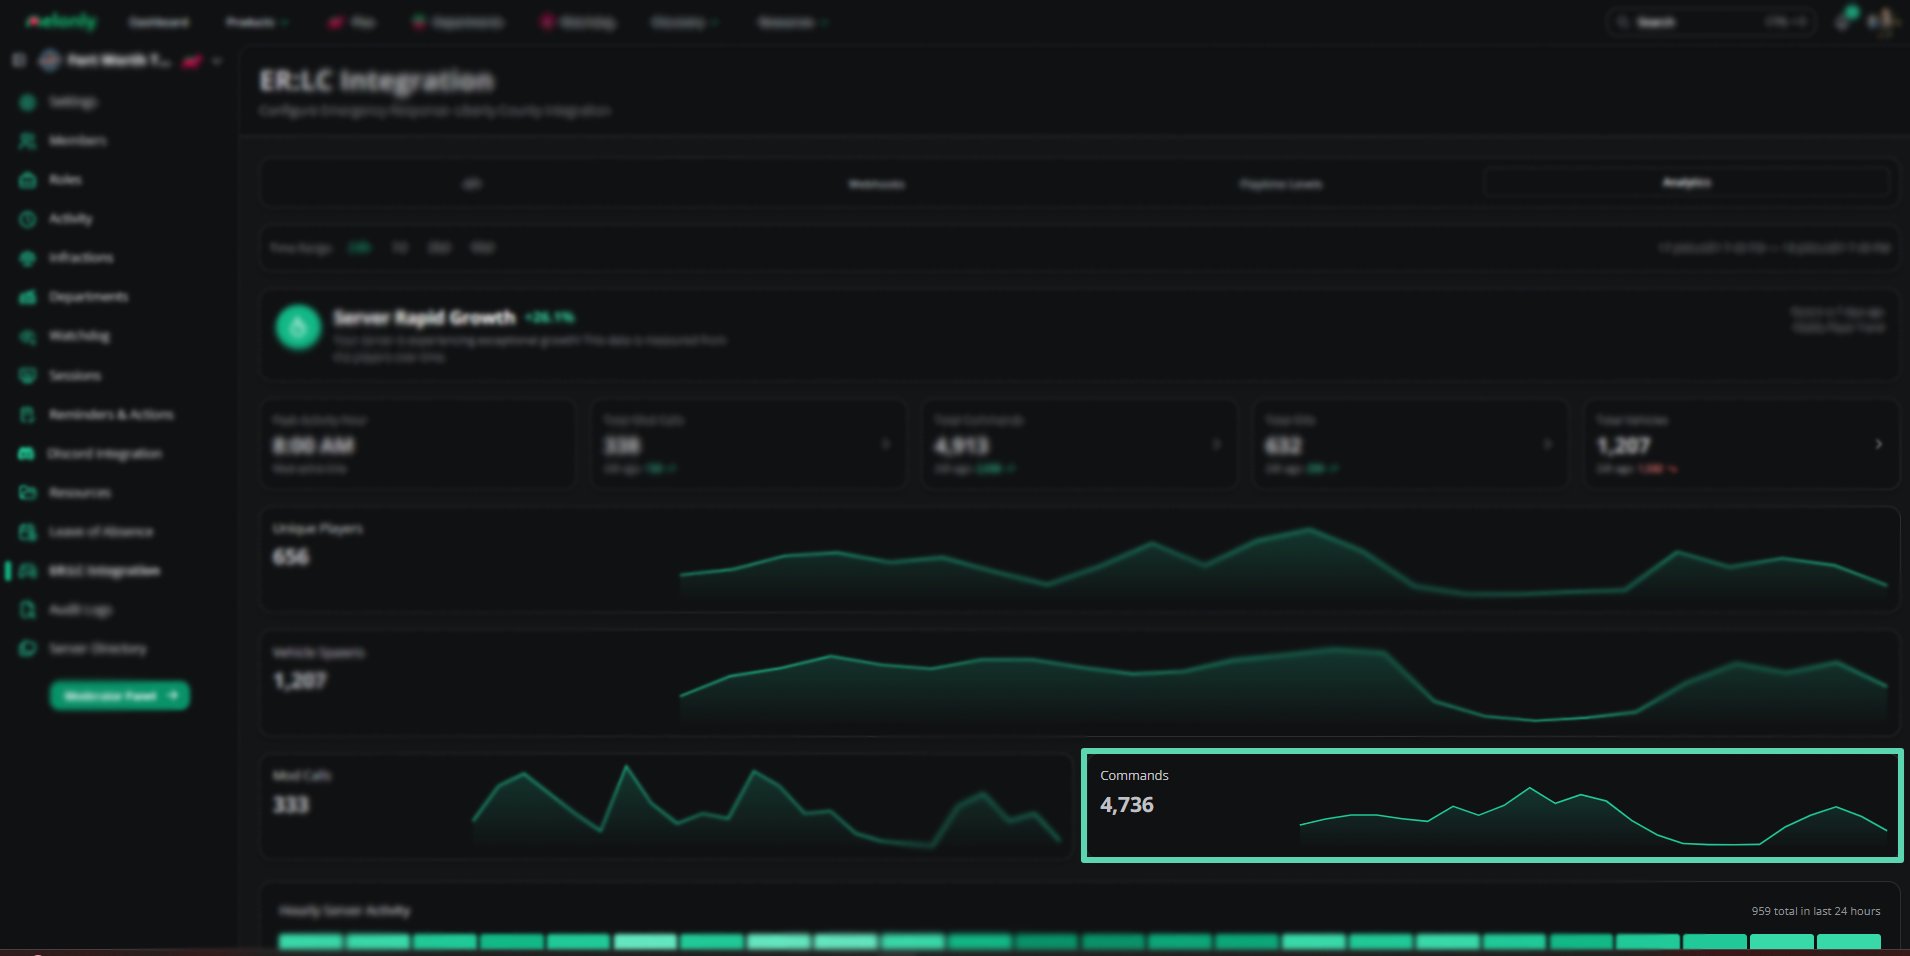
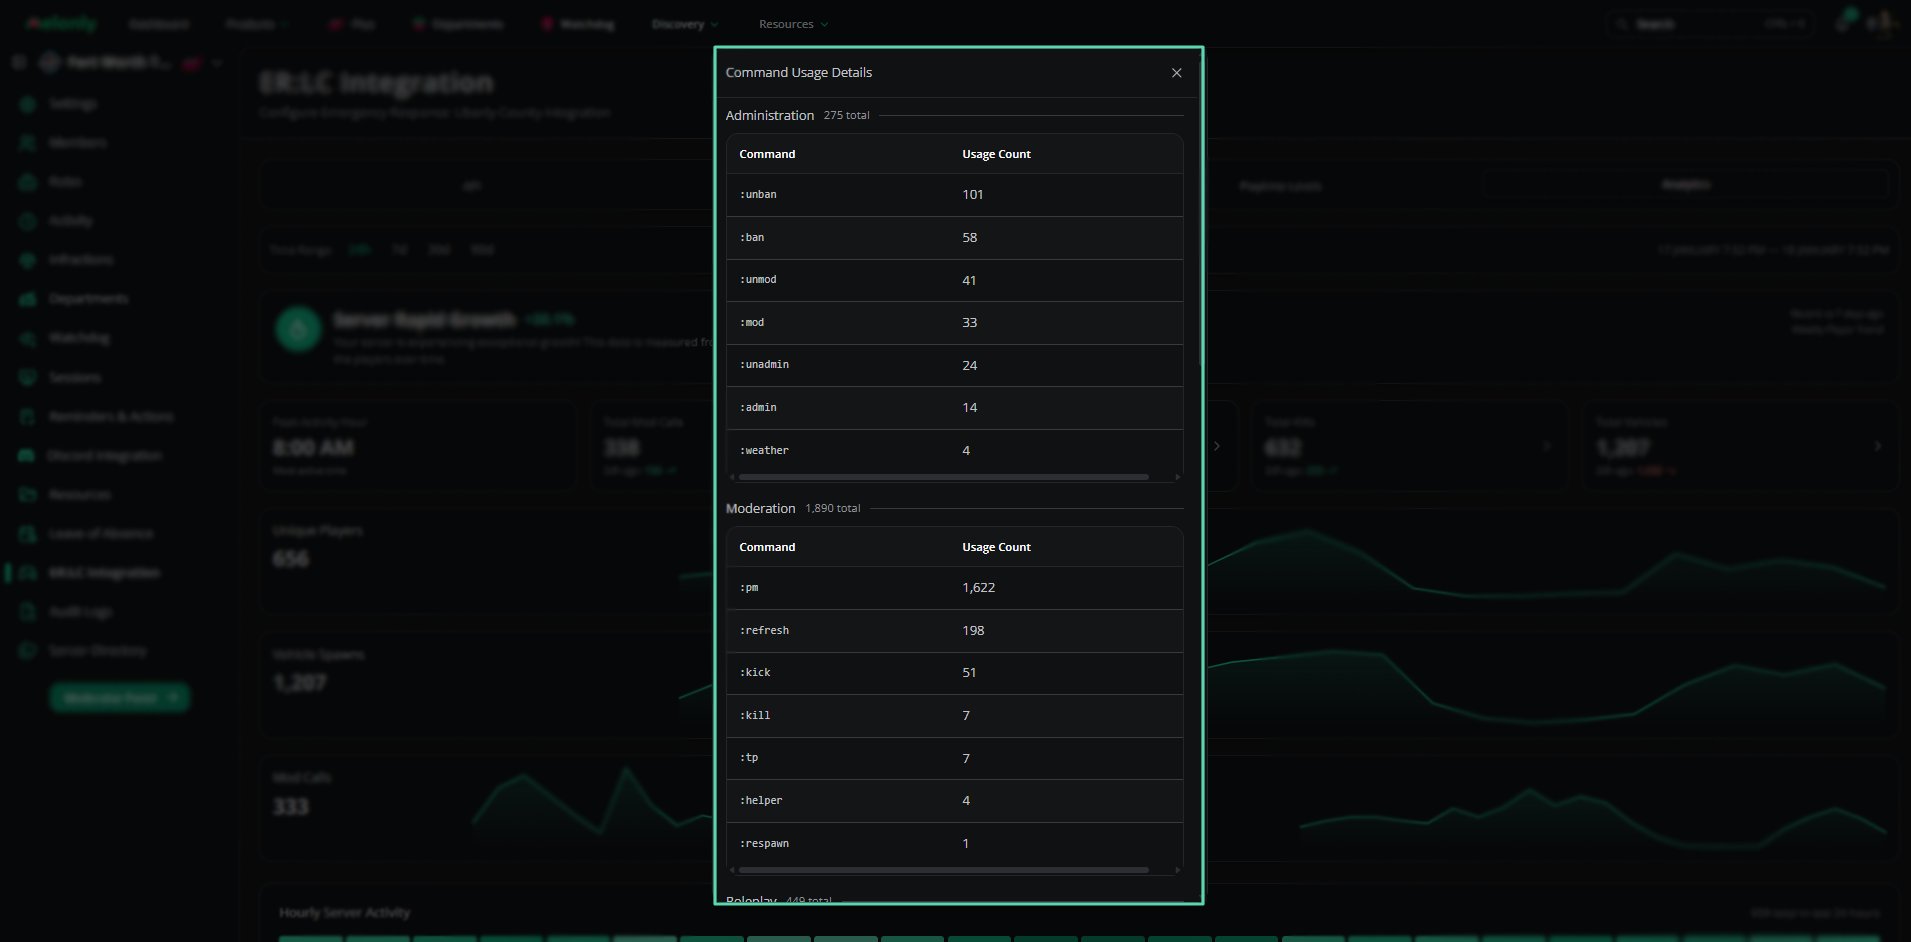 | Metric | Description |
| --------------- | --------------------------------------------------------------------- |
| Total Mod Calls | The total number of mod calls made during the selected time range. |
| Total Commands | The total number of commands executed during the selected time range. |
| Command Usage | A breakdown of which commands were used most frequently. |
***
### Kill and Vehicle Metrics
| Metric | Description |
| --------------- | --------------------------------------------------------------------- |
| Total Mod Calls | The total number of mod calls made during the selected time range. |
| Total Commands | The total number of commands executed during the selected time range. |
| Command Usage | A breakdown of which commands were used most frequently. |
***
### Kill and Vehicle Metrics
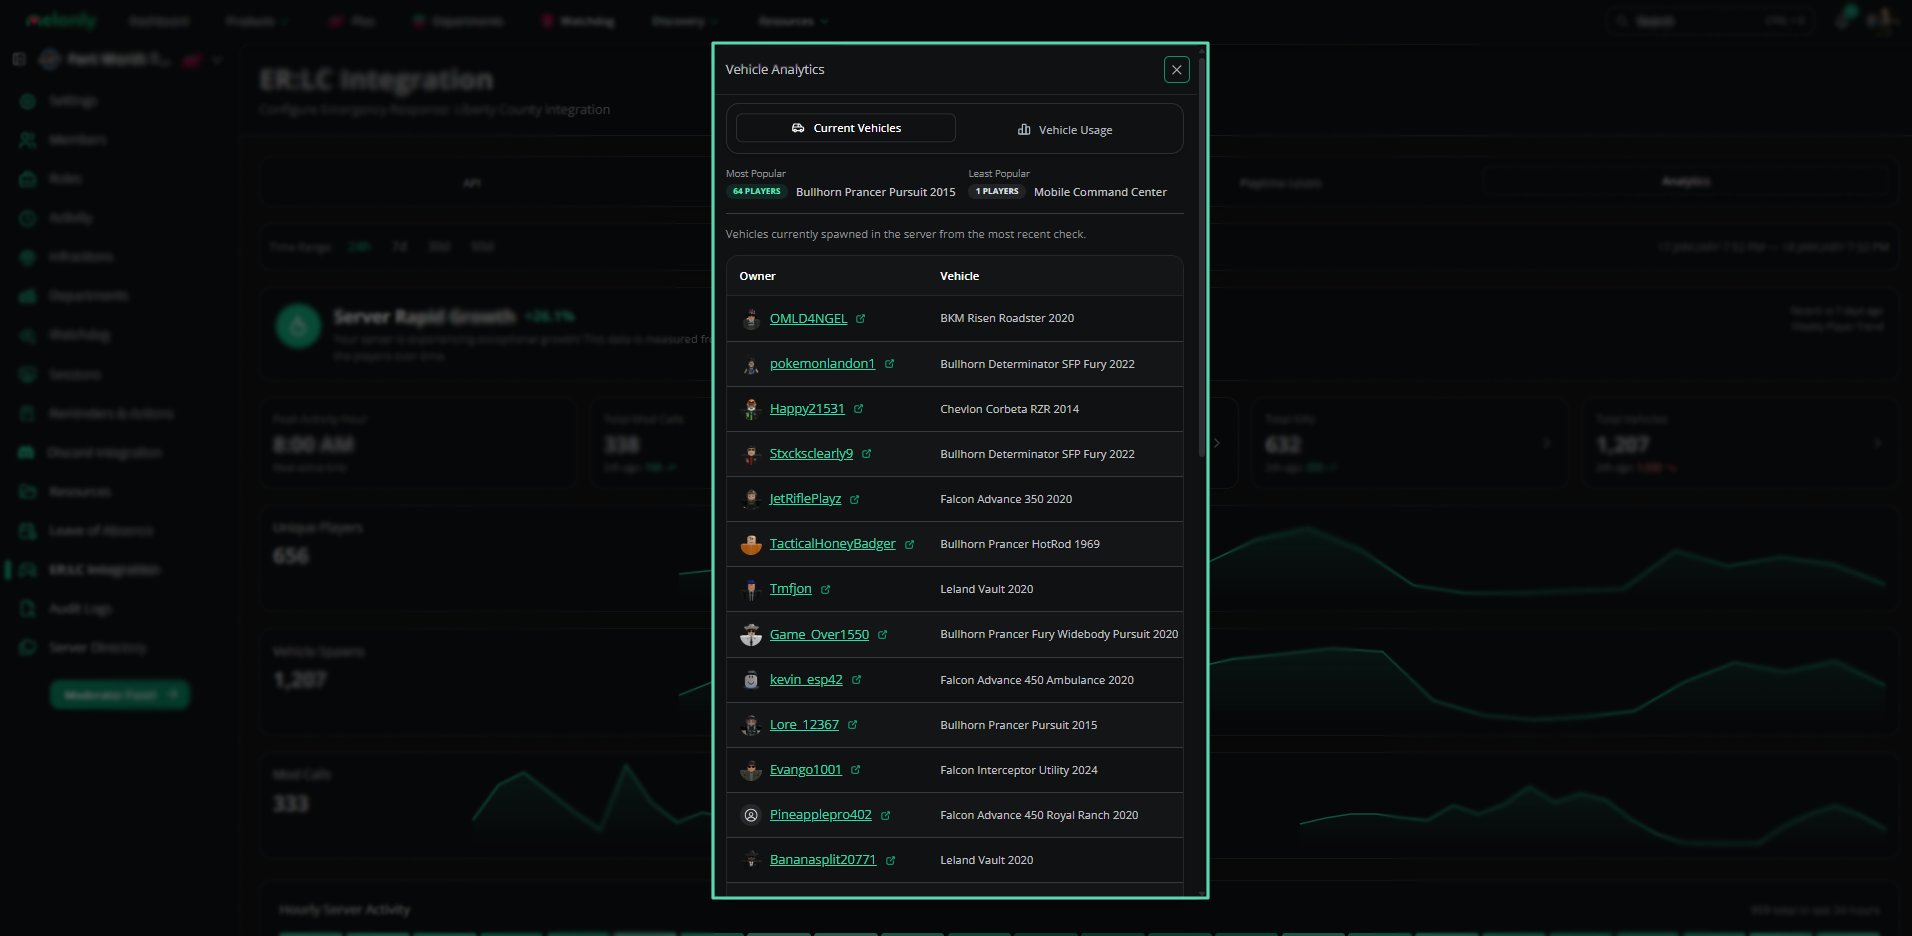
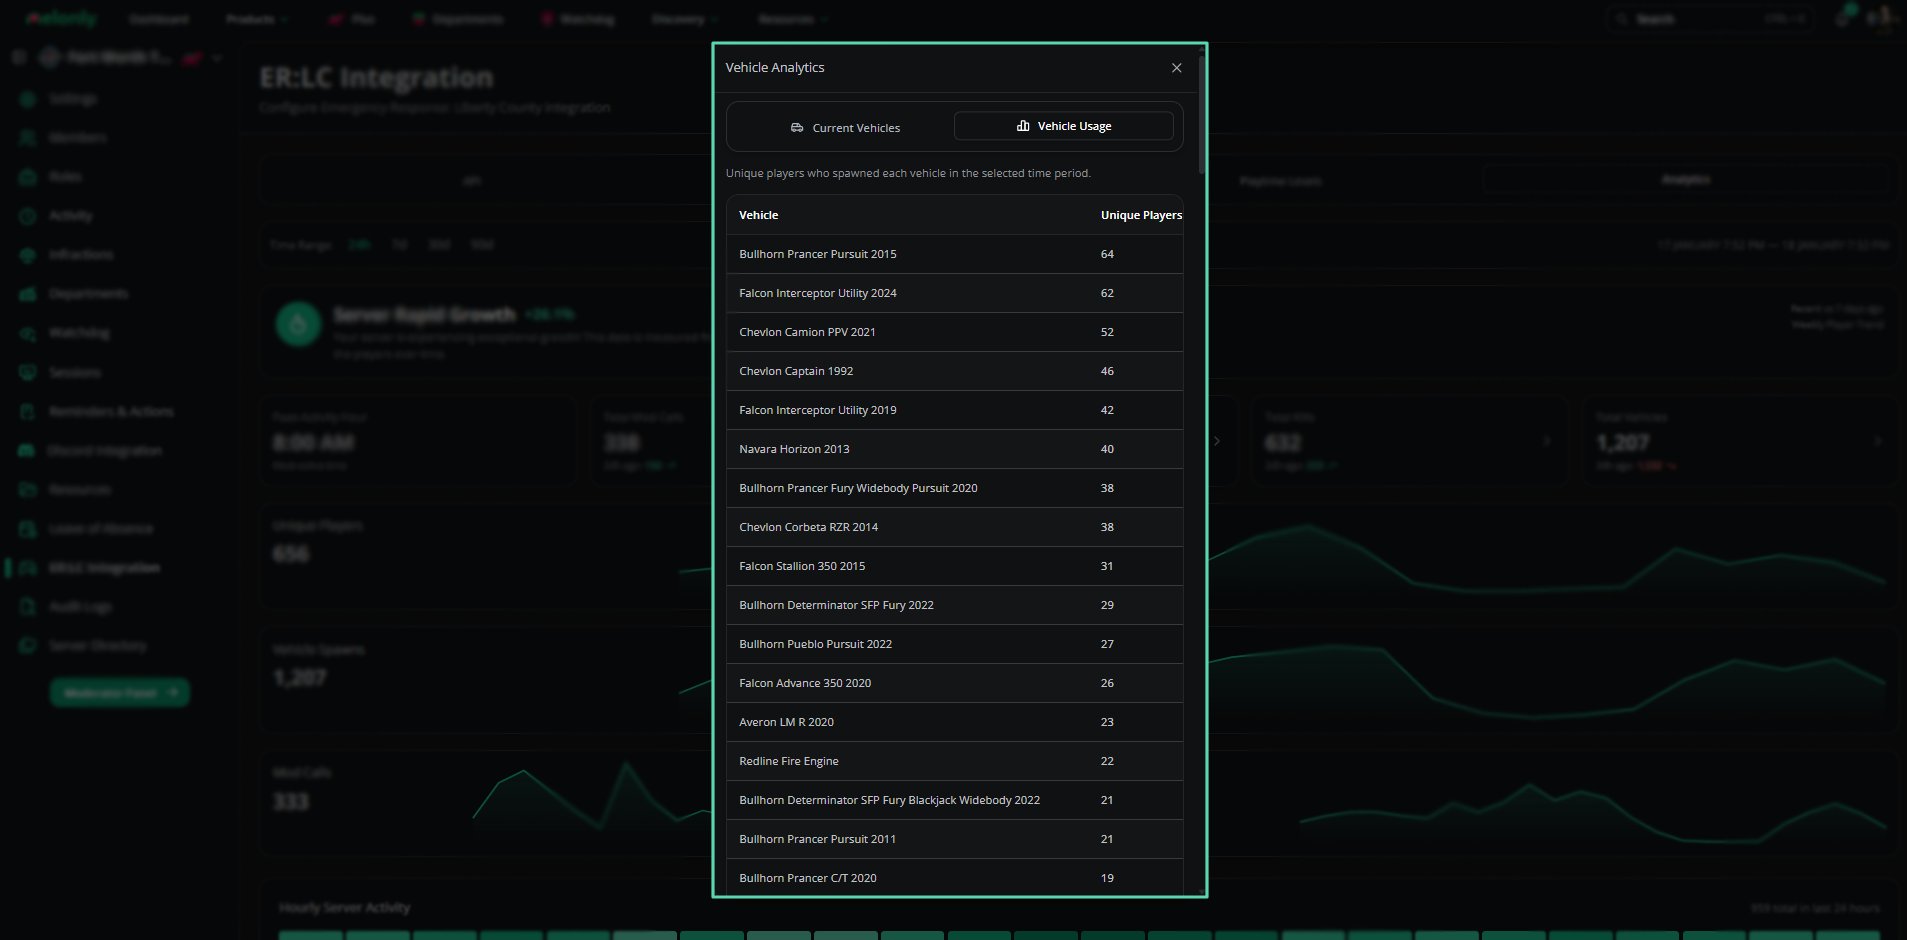 | Metric | Description |
| -------------- | -------------------------------------------------------------------- |
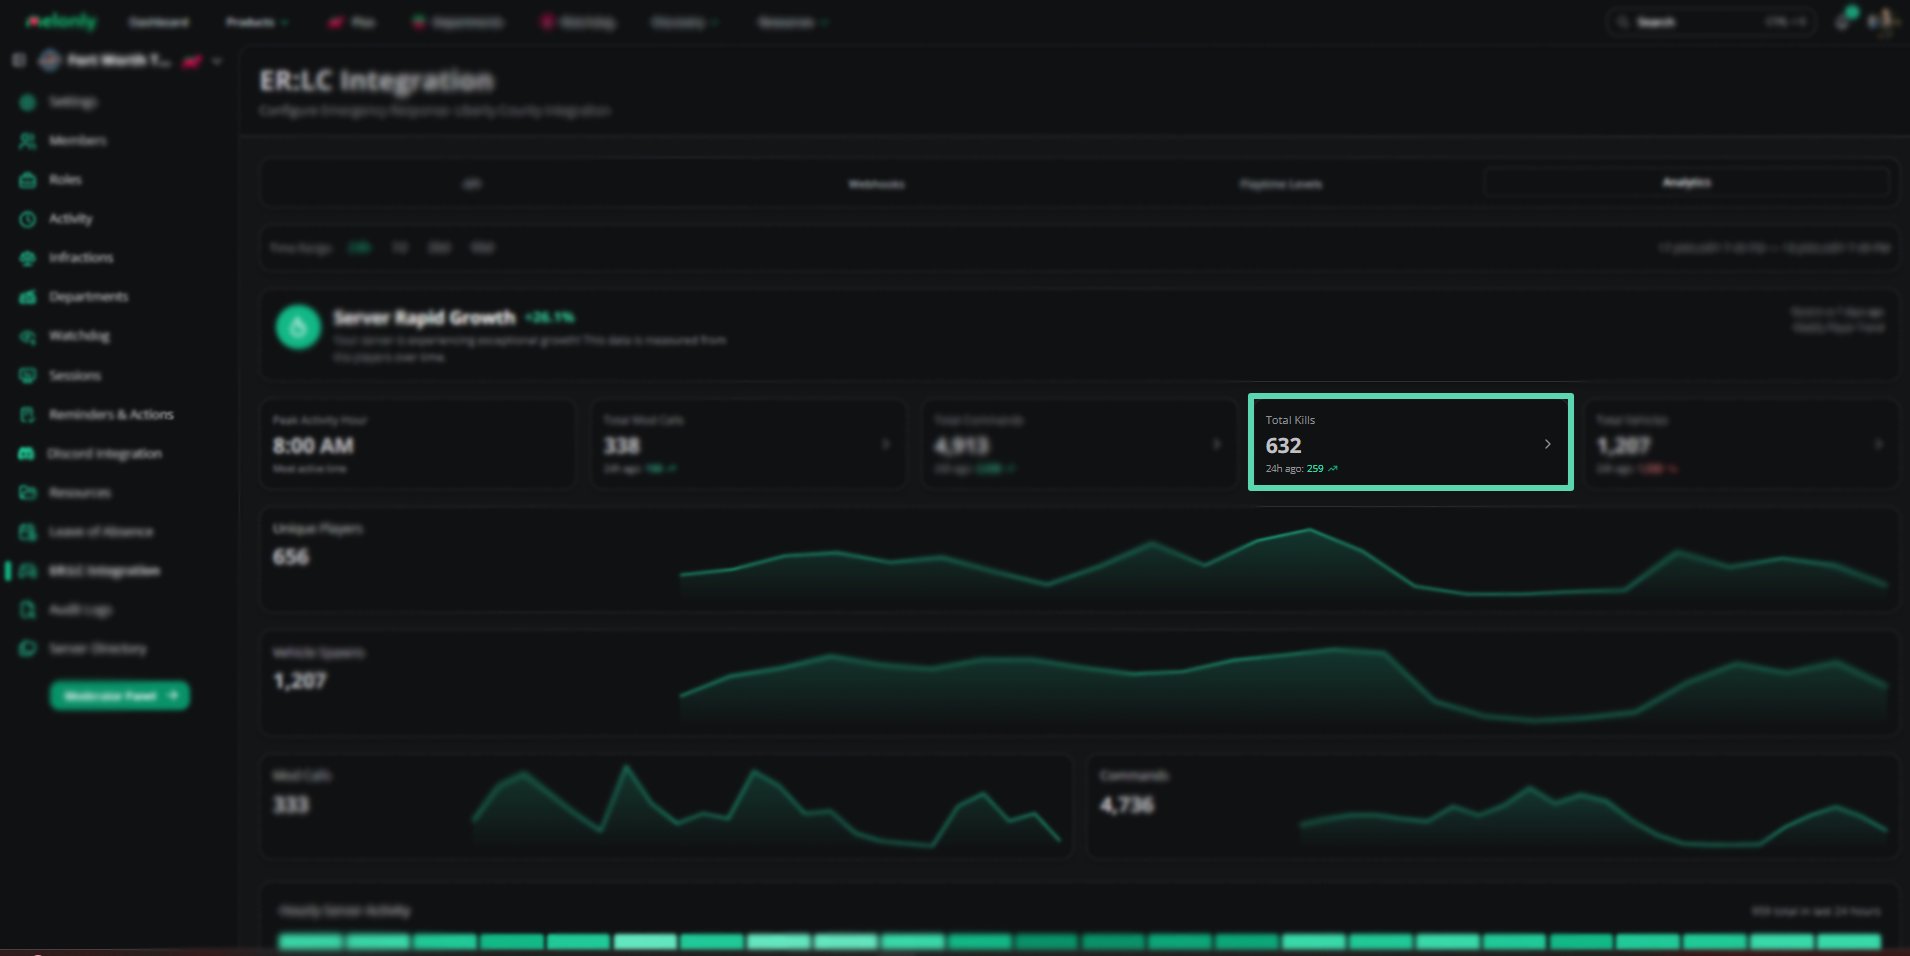
| Total Kills | The total number of kills recorded during the selected time range. |
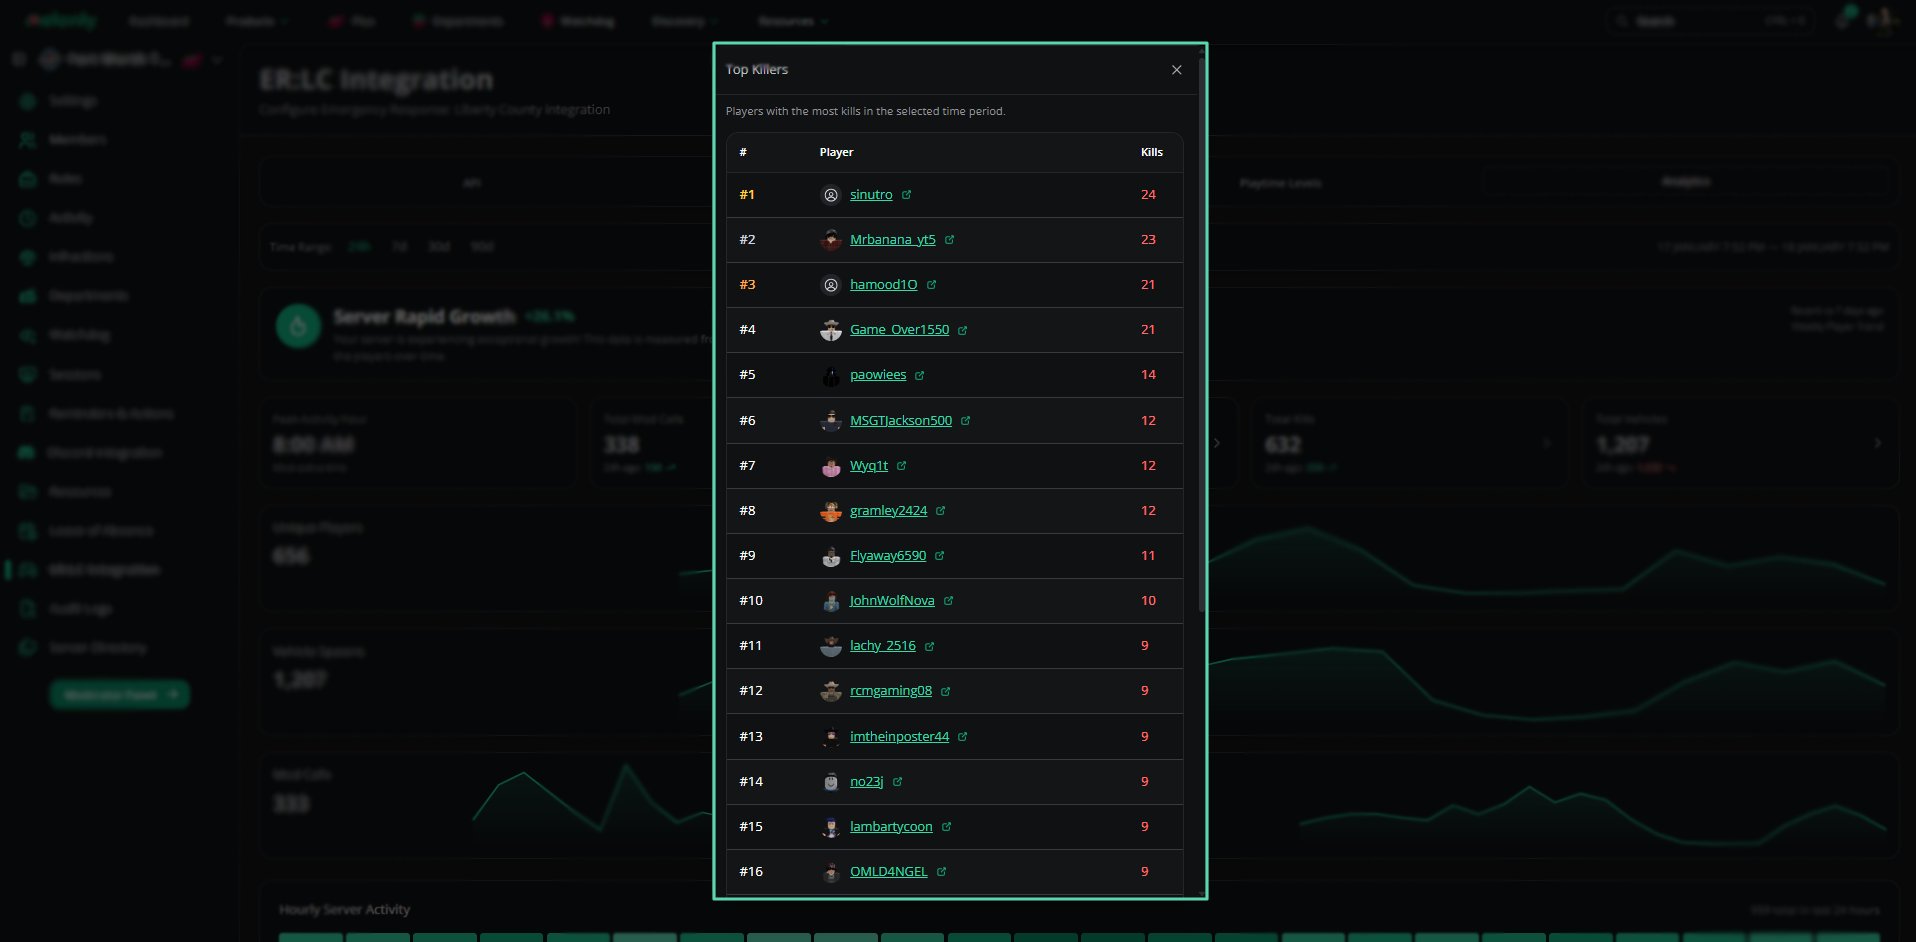
| Top Killers | A ranked list of players with the most kills in the selected period. |
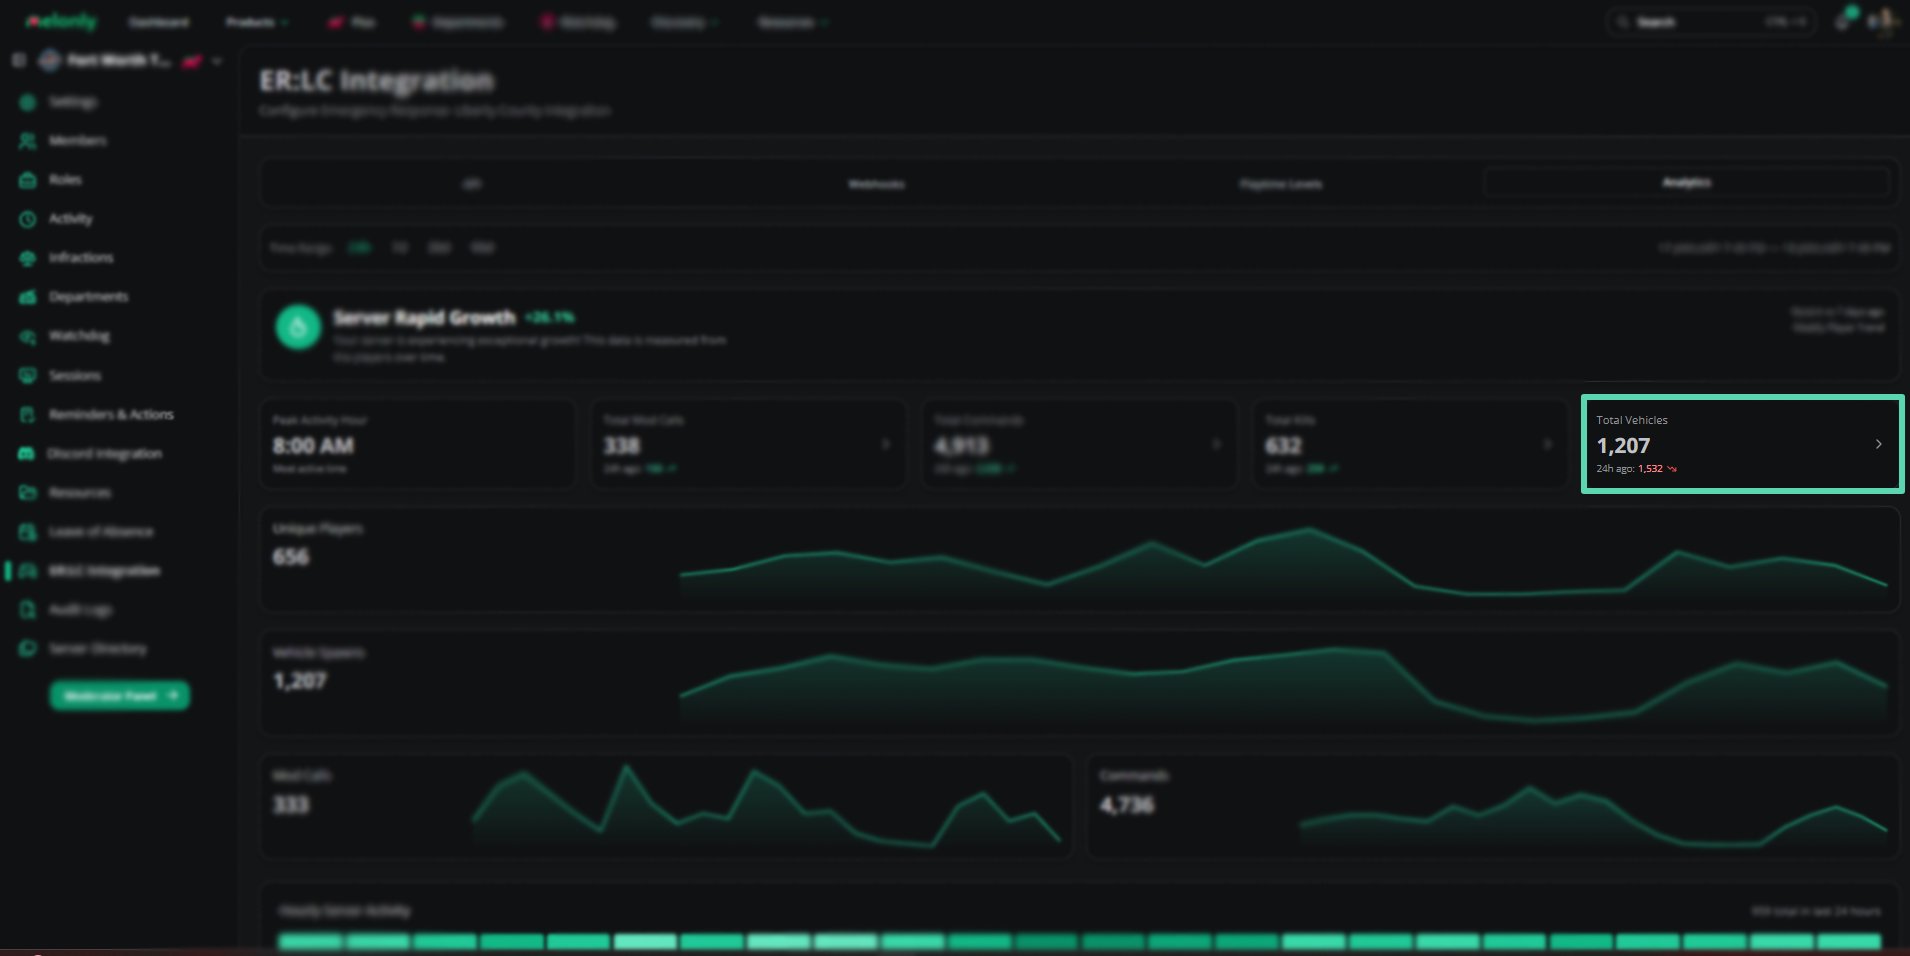
| Total Vehicles | The total number of vehicle spawns during the selected time range. |
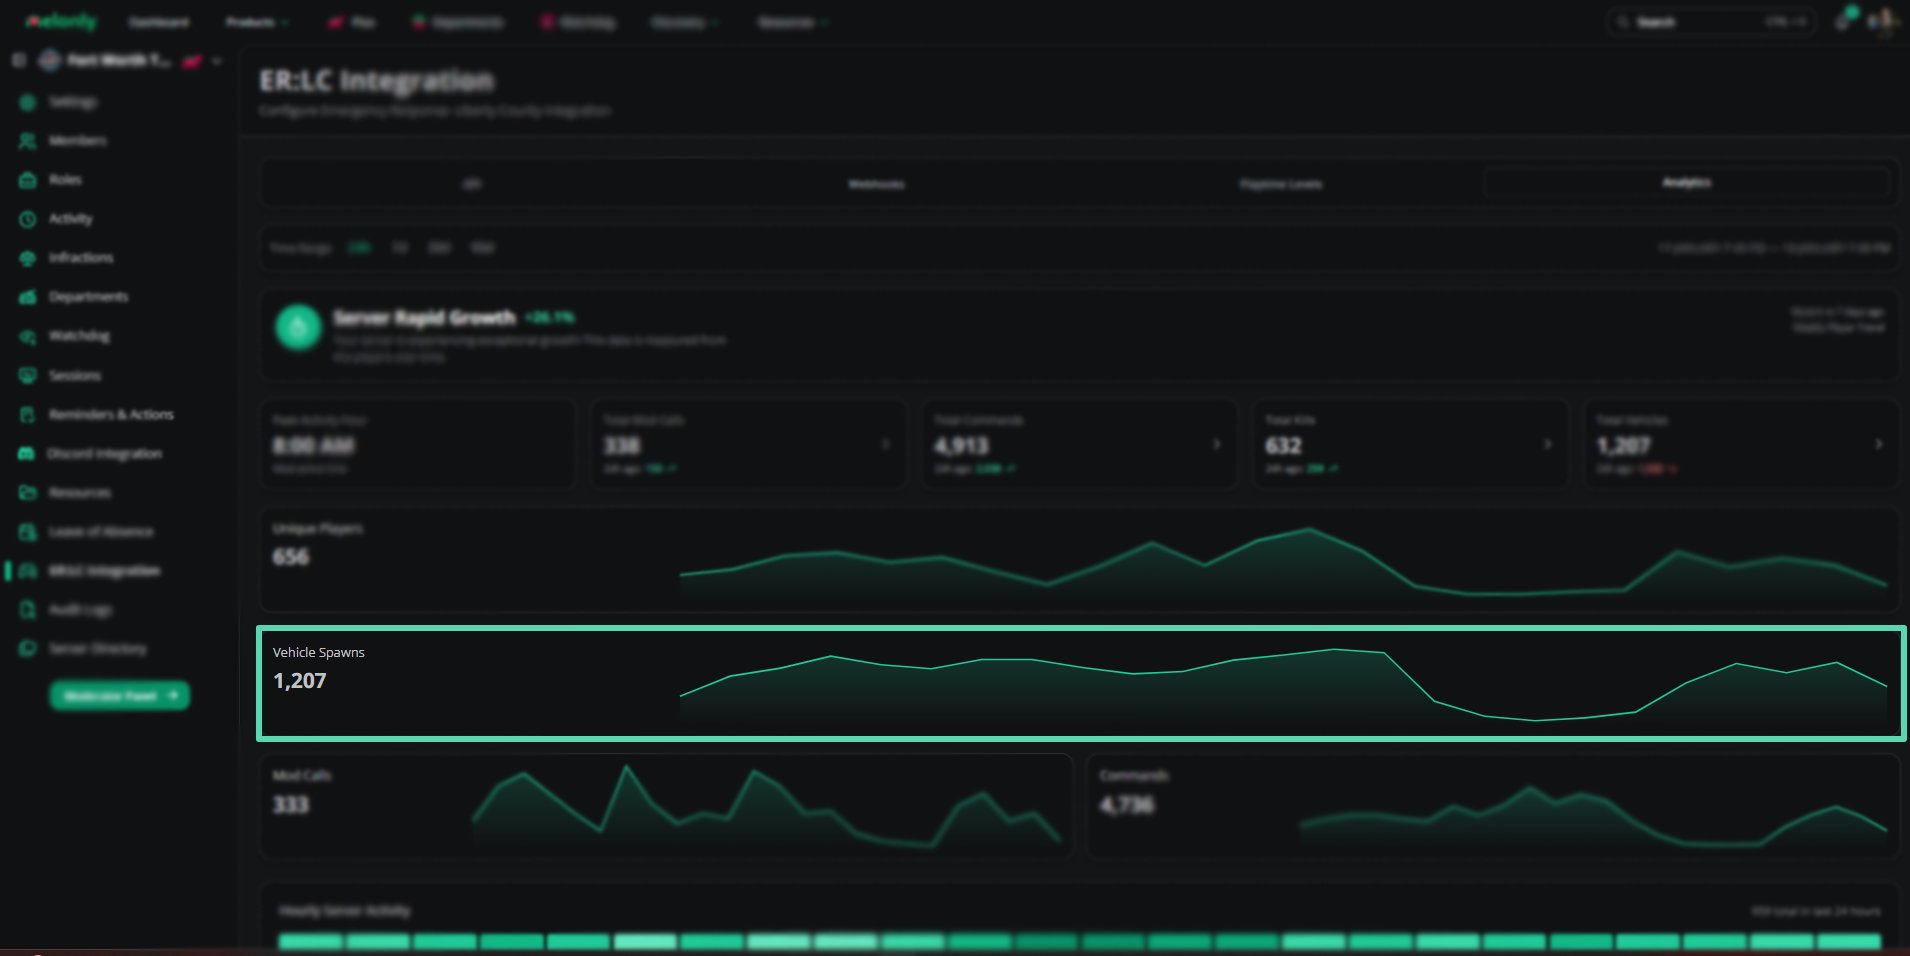
| Vehicle Usage | A breakdown of which vehicles were spawned most frequently. |
***
### Average Playtime & Player Retention
| Metric | Description |
| -------------- | -------------------------------------------------------------------- |
| Total Kills | The total number of kills recorded during the selected time range. |
| Top Killers | A ranked list of players with the most kills in the selected period. |
| Total Vehicles | The total number of vehicle spawns during the selected time range. |
| Vehicle Usage | A breakdown of which vehicles were spawned most frequently. |
***
### Average Playtime & Player Retention
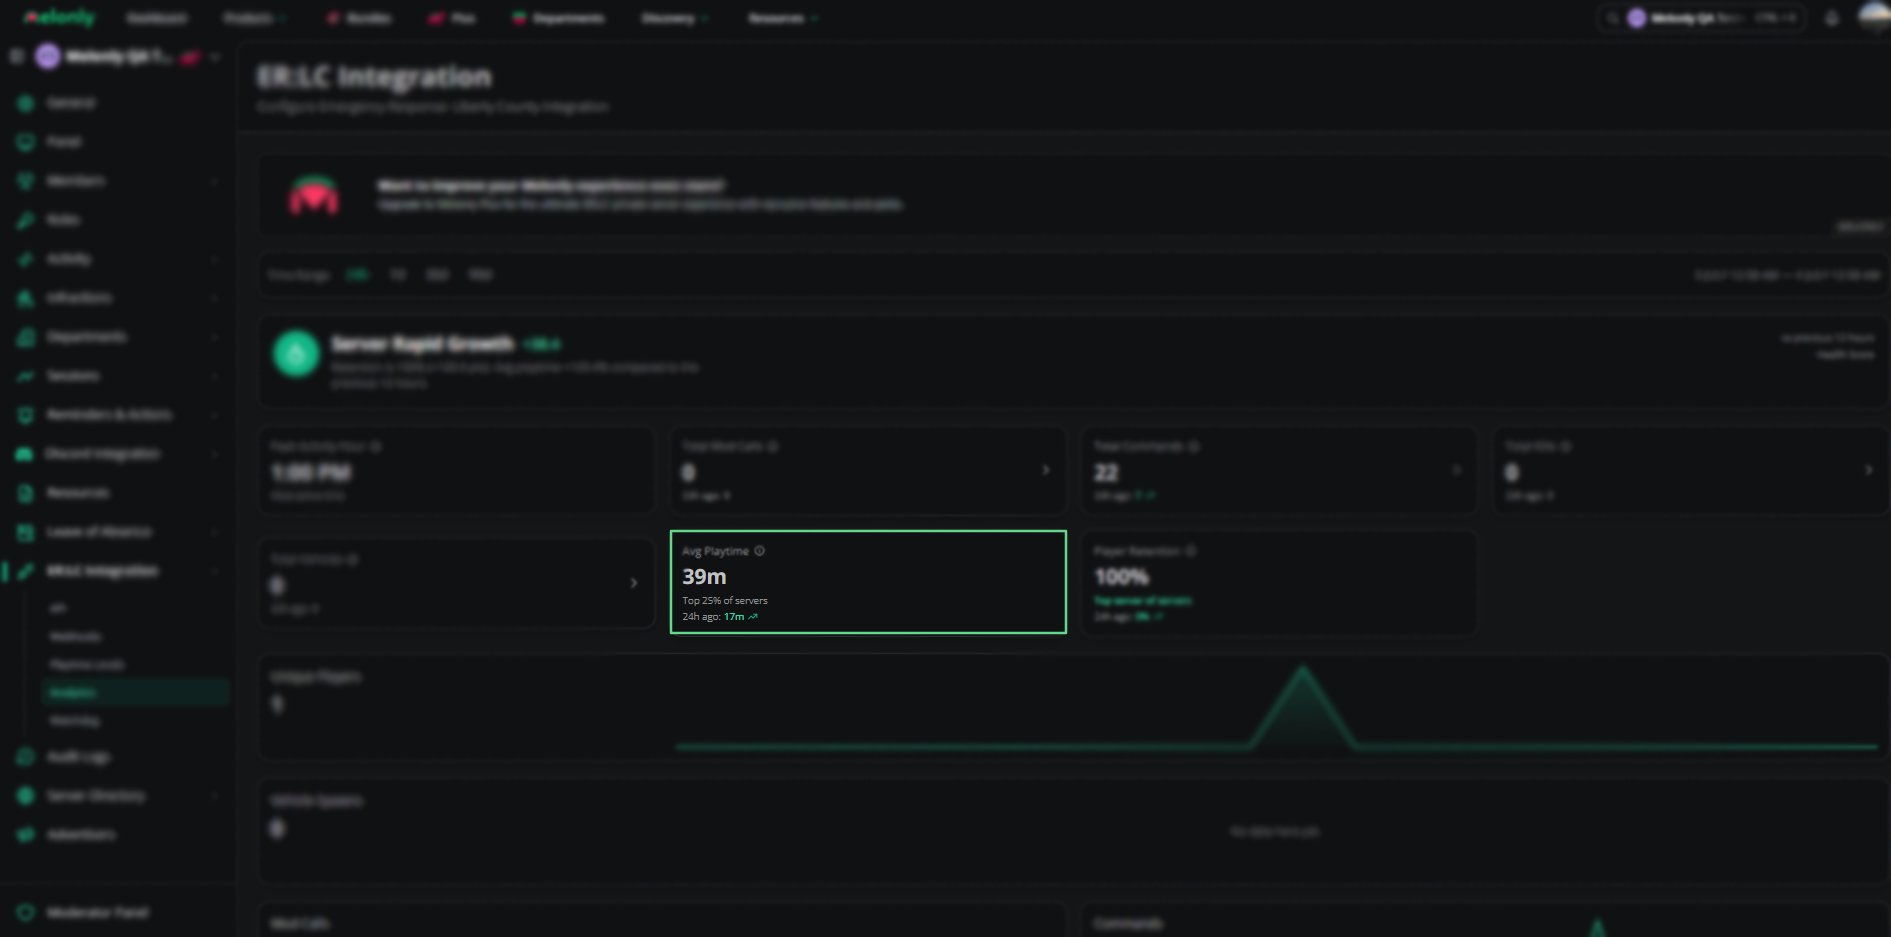
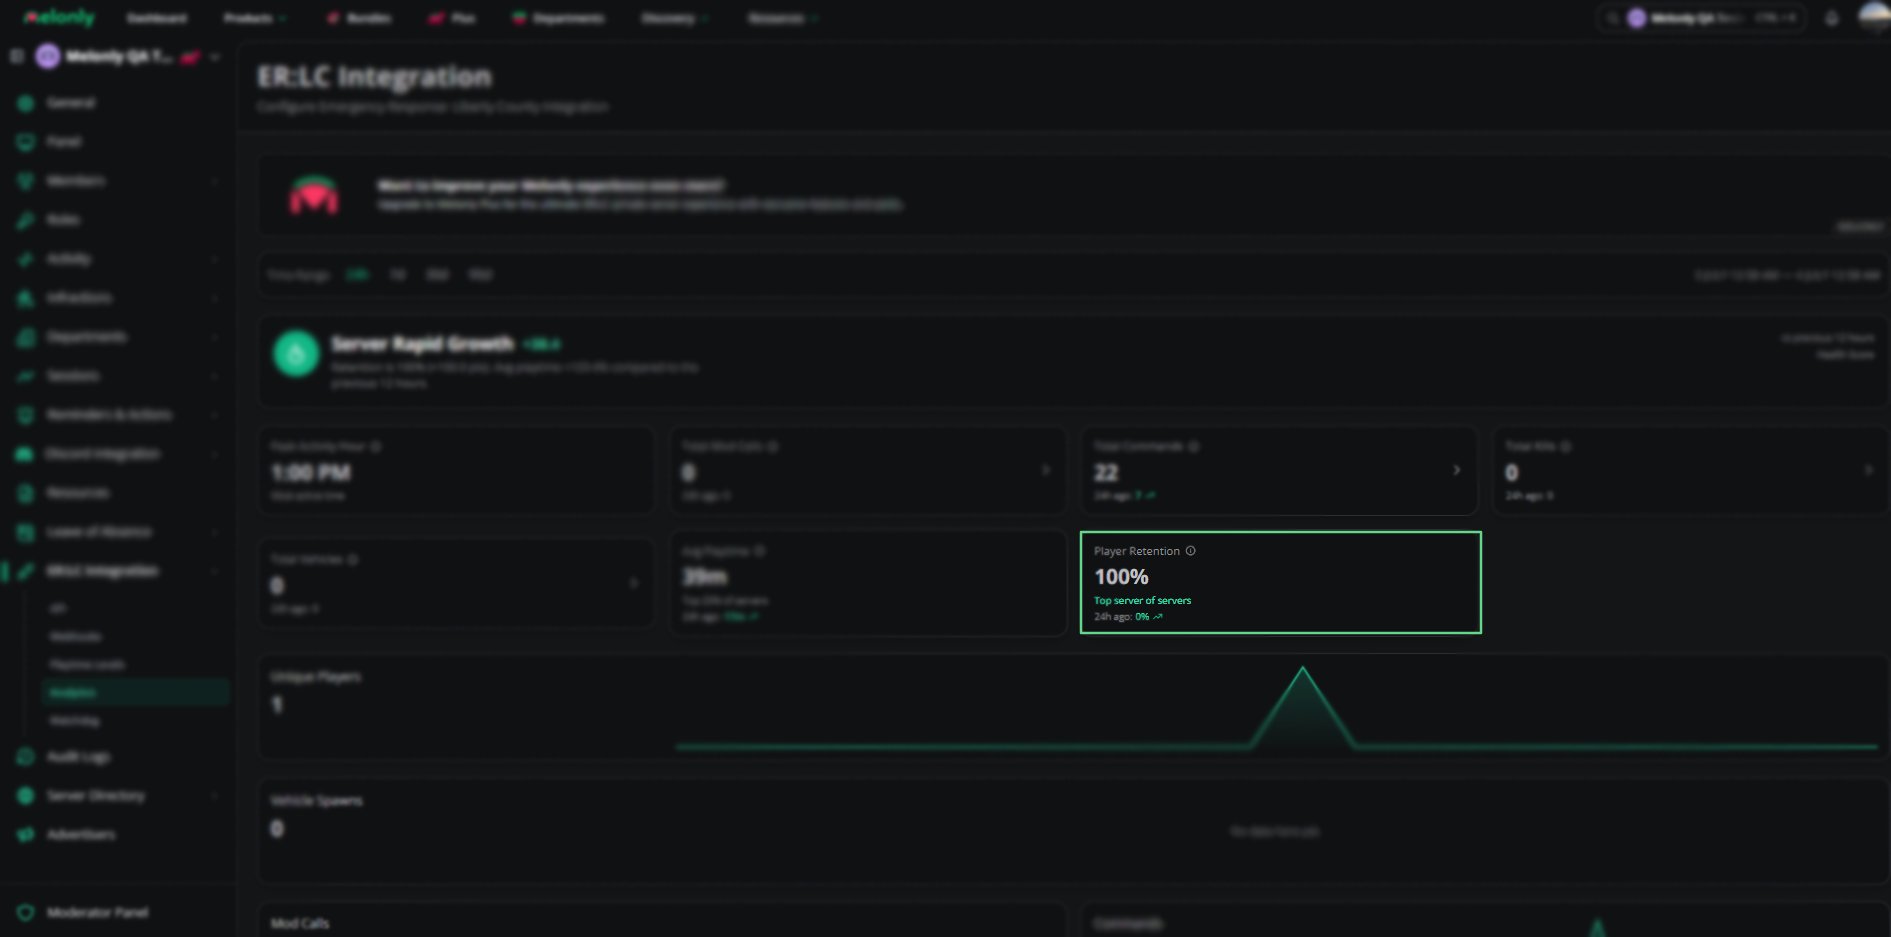 | Metric | Description |
| ---------------- | ---------------------------------------------------------------------- |
| Average Playtime | The average amount of time a player spends in your server |
| Player Retention | The percentage of players that returned from a previous period/session |
***
### Hourly Activity and Map Heatmap
| Metric | Description |
| ---------------- | ---------------------------------------------------------------------- |
| Average Playtime | The average amount of time a player spends in your server |
| Player Retention | The percentage of players that returned from a previous period/session |
***
### Hourly Activity and Map Heatmap

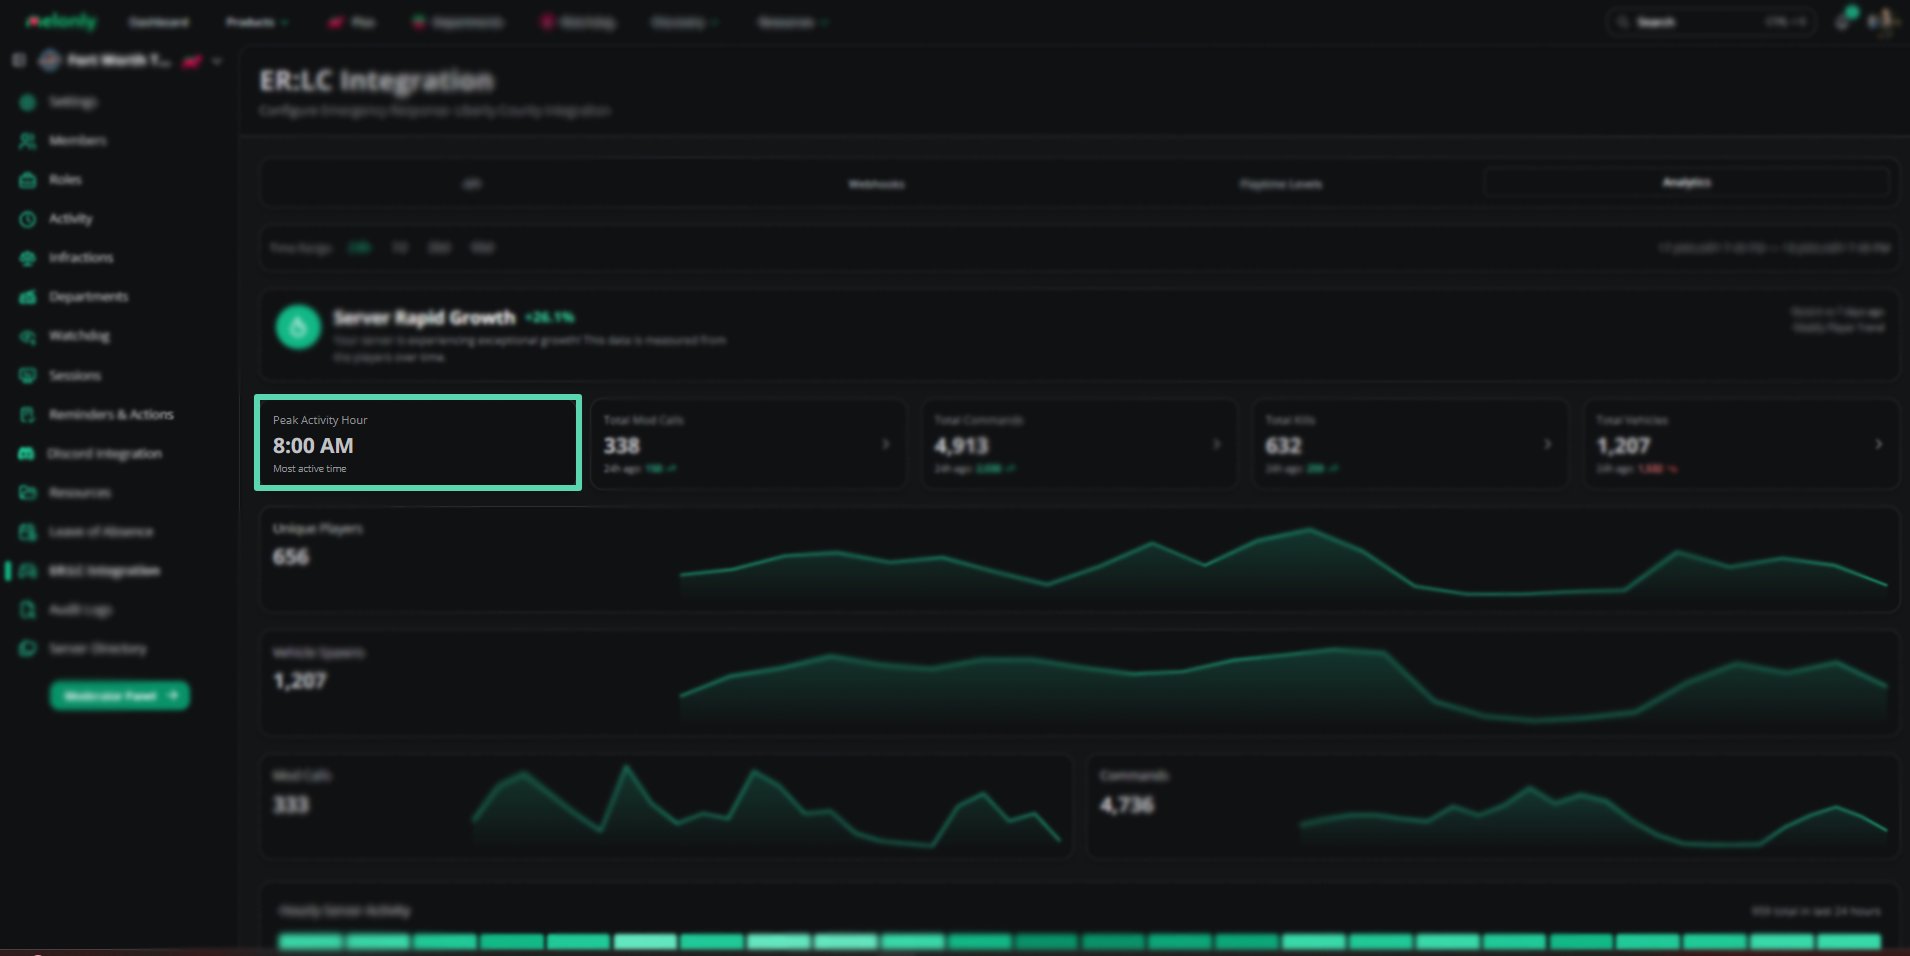 | Metric | Description |
| ---------------------- | --------------------------------------------------------------------------------- |
| Hourly Server Activity | A bar chart showing activity totals broken down by hour across the last 24 hours. |
| Peak Activity Hour | The single hour with the highest recorded activity in the selected period. |
***
### Player Leaderboard and Comparison
| Metric | Description |
| ---------------------- | --------------------------------------------------------------------------------- |
| Hourly Server Activity | A bar chart showing activity totals broken down by hour across the last 24 hours. |
| Peak Activity Hour | The single hour with the highest recorded activity in the selected period. |
***
### Player Leaderboard and Comparison
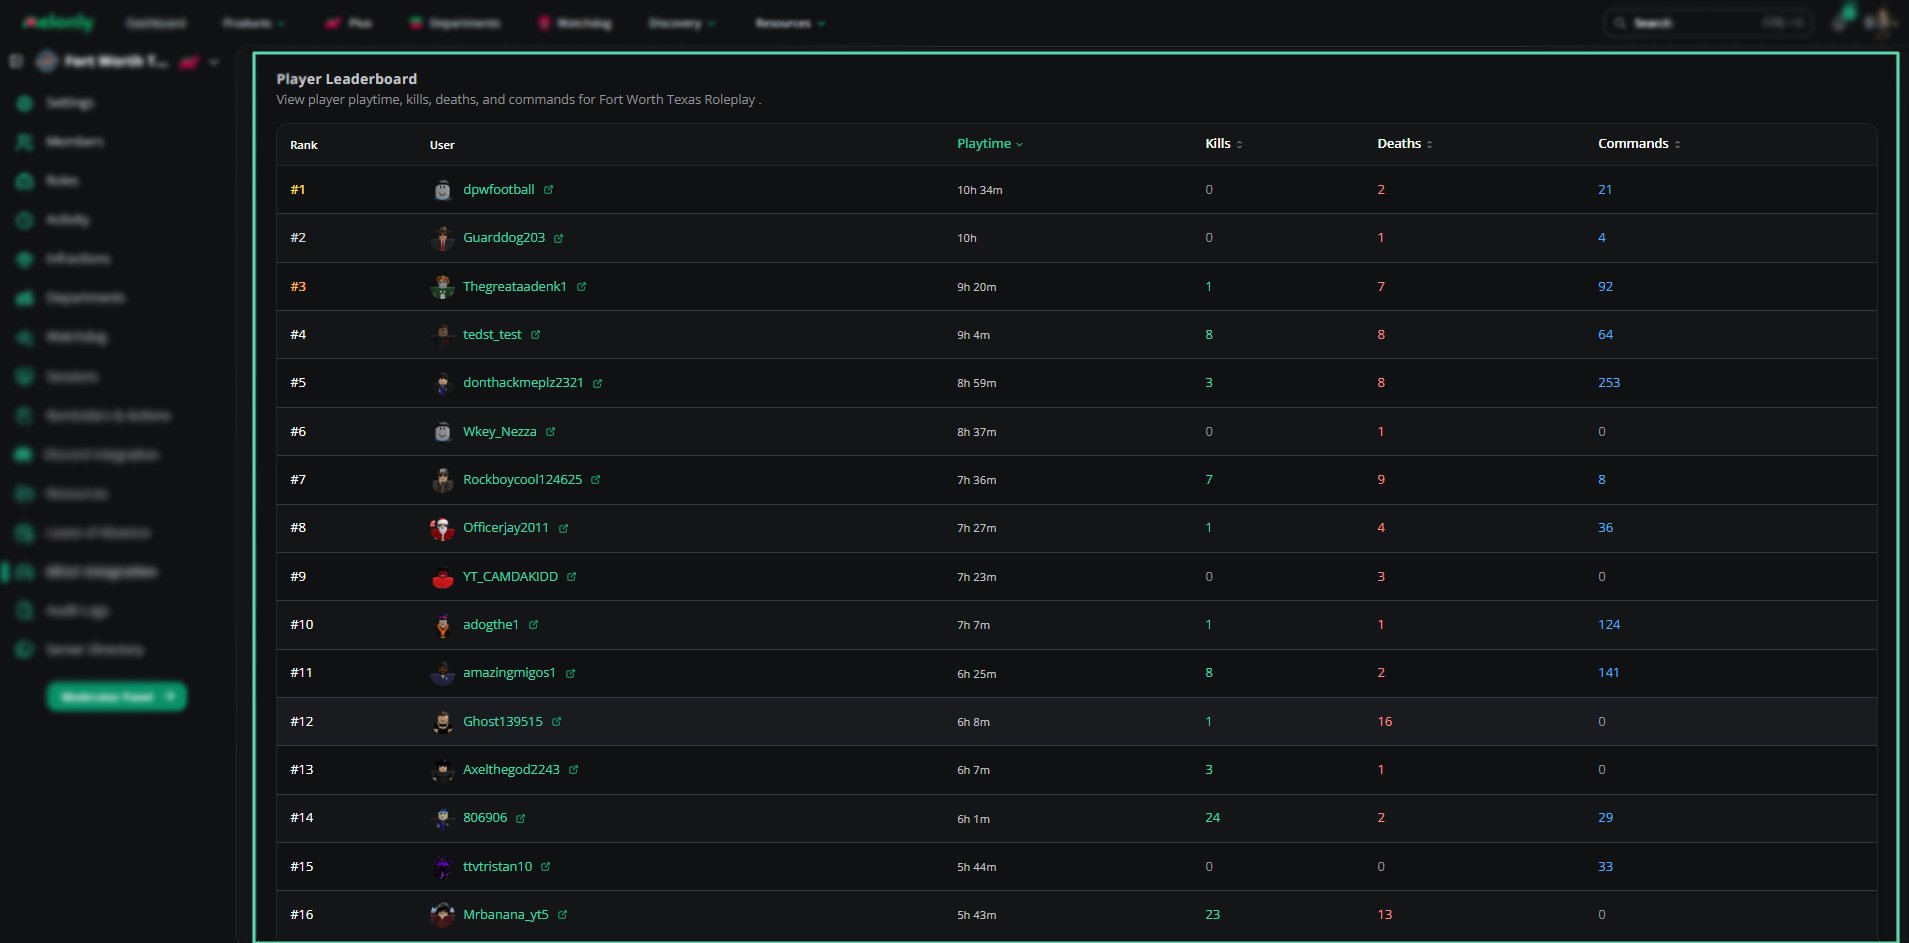
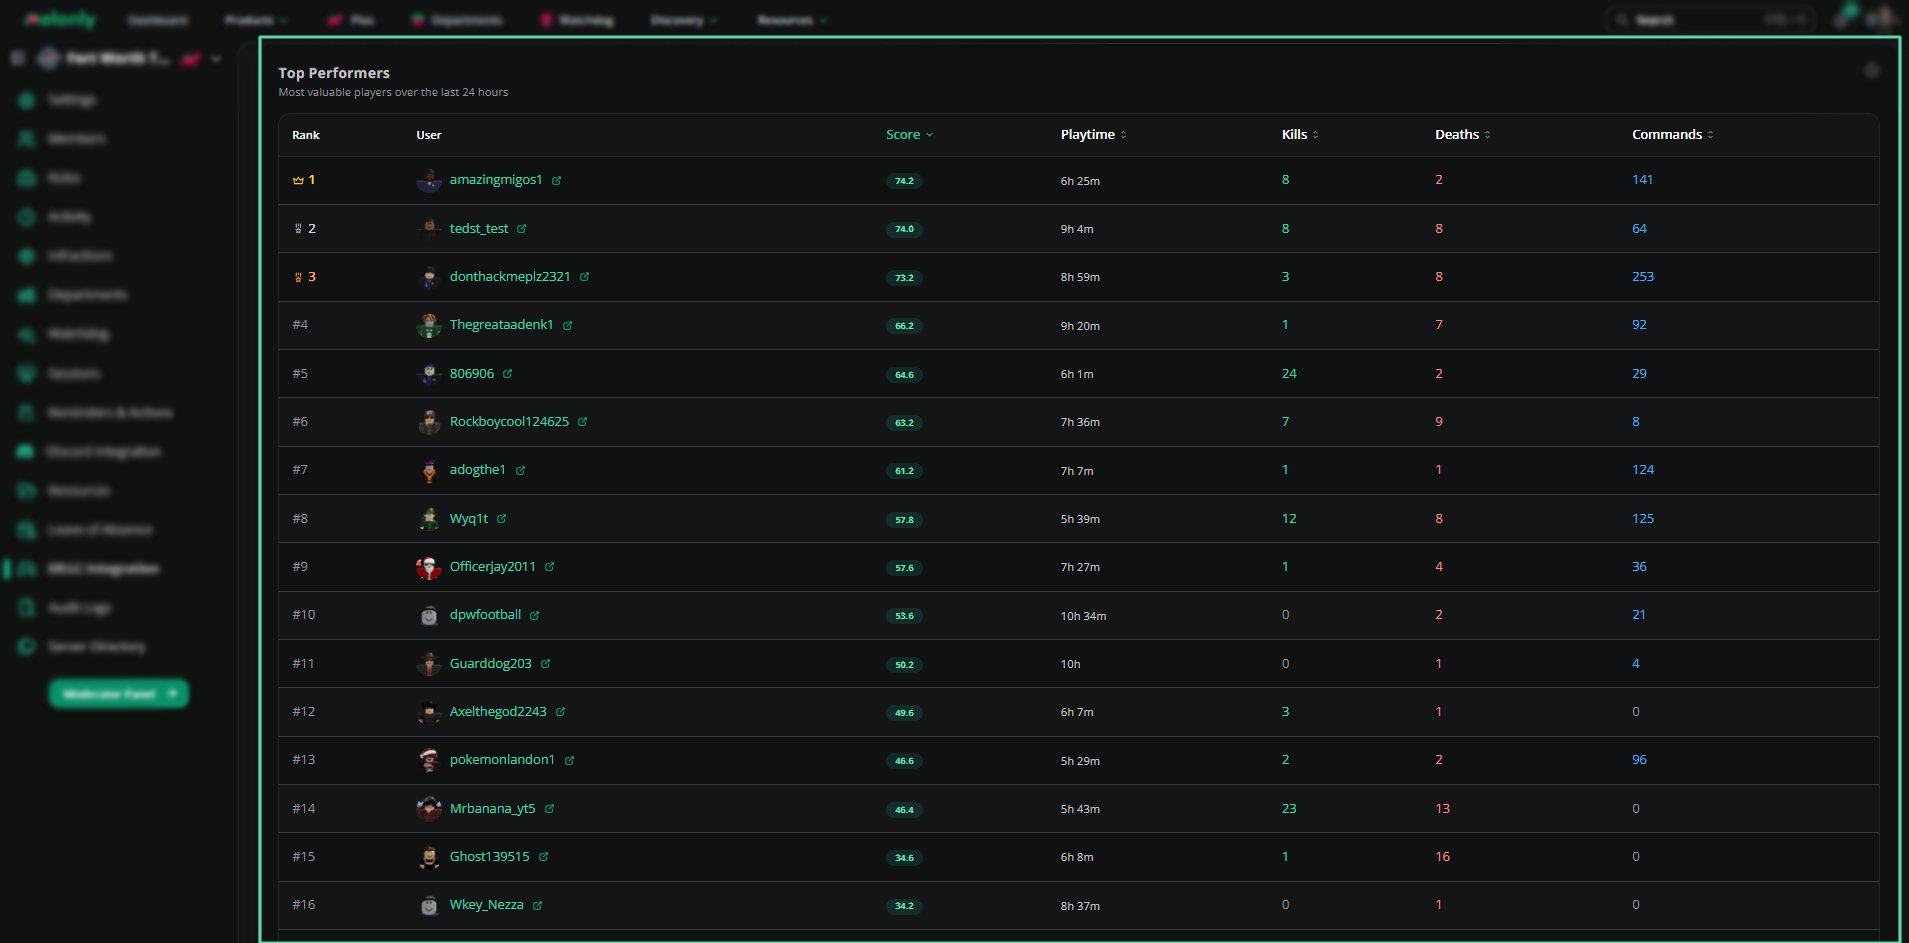
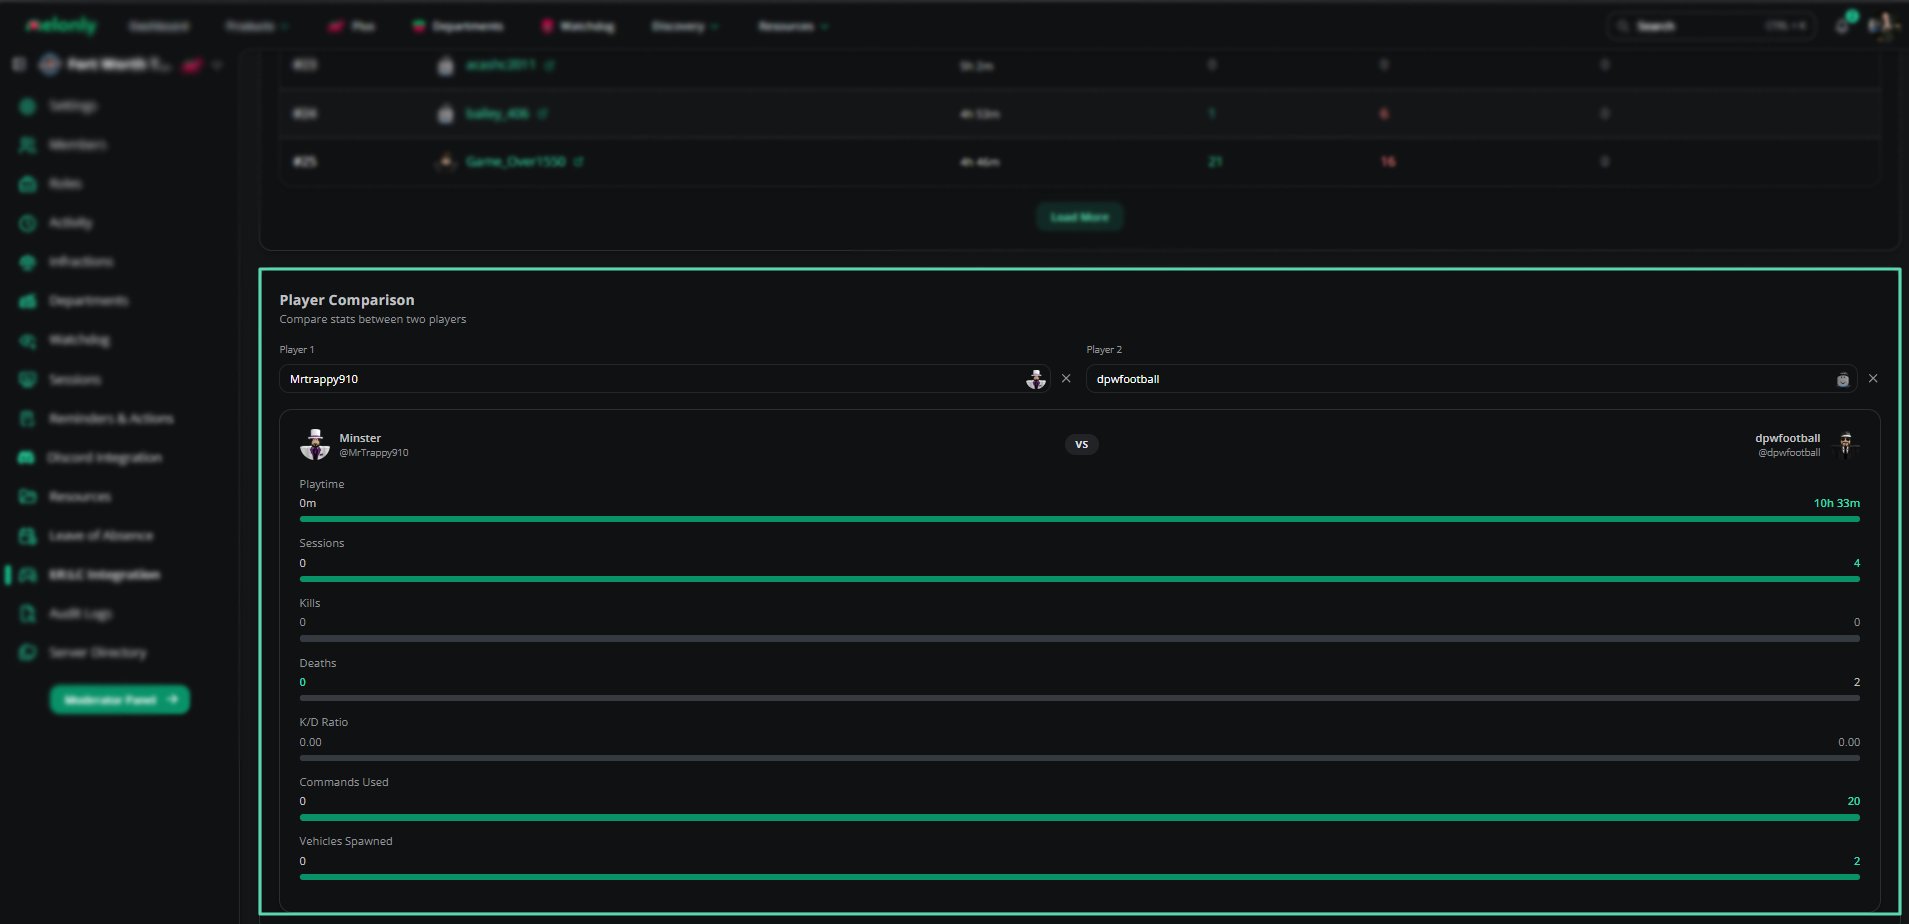
 | Section | Description |
| ------------------ | ------------------------------------------------------------------------------------------- |
| Top Performers | Displays the most valuable players over the selected time period based on overall activity. |
| Player Leaderboard | Shows playtime, kills, deaths, and commands for all tracked players. |
| Player Comparison | Search two players by username and compare their stats side by side. |
| Unique Players | The number of distinct players active during the selected time range. |
| Peak Playtime | The time period with the highest recorded player playtime. |
***
## How to Configure
Navigate to your Melonly dashboard and then **ER:LC Integration -> Analytics**
Use the time range selector at the top of the page to choose between 24 hours, 7 days, 30 days or 90 days of data.
Browse the overview cards, hourly activity chart, and individual metric sections to understand your server's performance during the selected period.
Scroll to the Player Comparison section, enter two player usernames, and view their stats side by side.
***
## Example Use Cases
* Reviewing which hours of the day your server is most active.
* Comparing two staff members' activity stats.
* Tracking week over week trends in unique players to measure server growth.
***
Still have questions? Join our Discord server for support from the Melonly Team.
| Section | Description |
| ------------------ | ------------------------------------------------------------------------------------------- |
| Top Performers | Displays the most valuable players over the selected time period based on overall activity. |
| Player Leaderboard | Shows playtime, kills, deaths, and commands for all tracked players. |
| Player Comparison | Search two players by username and compare their stats side by side. |
| Unique Players | The number of distinct players active during the selected time range. |
| Peak Playtime | The time period with the highest recorded player playtime. |
***
## How to Configure
Navigate to your Melonly dashboard and then **ER:LC Integration -> Analytics**
Use the time range selector at the top of the page to choose between 24 hours, 7 days, 30 days or 90 days of data.
Browse the overview cards, hourly activity chart, and individual metric sections to understand your server's performance during the selected period.
Scroll to the Player Comparison section, enter two player usernames, and view their stats side by side.
***
## Example Use Cases
* Reviewing which hours of the day your server is most active.
* Comparing two staff members' activity stats.
* Tracking week over week trends in unique players to measure server growth.
***
Still have questions? Join our Discord server for support from the Melonly Team.